Riding the third wave of immigration
North Carolina was largely untouched by the first two waves of immigration to the United States. Between 1840 and 1889, the U.S. received 14.3 million immigrants, the majority from Northern/Western European countries such as Germany, Ireland, and the United Kingdom. Between 1890 and 1919, another 18.2 million arrived, mainly from Southern/Eastern European countries such as Italy, Russia, and Poland. Yet, in 1920, fewer than 10,000 of the nation’s 14.2 million immigrants lived in North Carolina.
The third major wave of immigration has significantly impacted the state’s population. Beginning in 1965 and intensifying in 1990, more than 44 million immigrants have arrived in the United States during the current wave. The nation’s foreign-born population nearly doubled between 1970 and 1990, rising from 11 million to 19.7 million, and doubled again between 1990 and 2010. Today, more than 725,000 of the nation’s 40.4 million immigrants live in North Carolina.
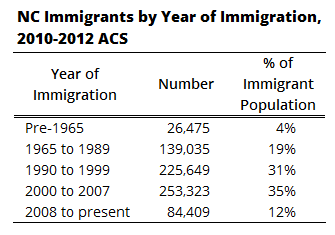
The emergence of North Carolina as a new immigrant destination state is evident in the data on year of immigration. Nationwide, the average immigrant has lived in the United States for 19.7 years; in North Carolina, the average is 15.6 years. The majority of North Carolina’s immigrants—77%—immigrated to the United States after 1989. Nearly one-third arrived in the U.S. in the 1990s and another third arrived in the pre-recession boom years (2000 to 2007). Though international immigration slowed substantially following the recession, more than 84,000 immigrants living in North Carolina arrived in the United States after 2008.
Immigrants from Latin American and Asian countries have dominated the current wave of immigration. The top 10 countries of origin among North Carolina immigrants reflect this shift. Four of the top 10 countries are Latin American—Mexico, El Salvador, Honduras, and Guatemala—and four are Asian—India, Vietnam, China, and Korea.
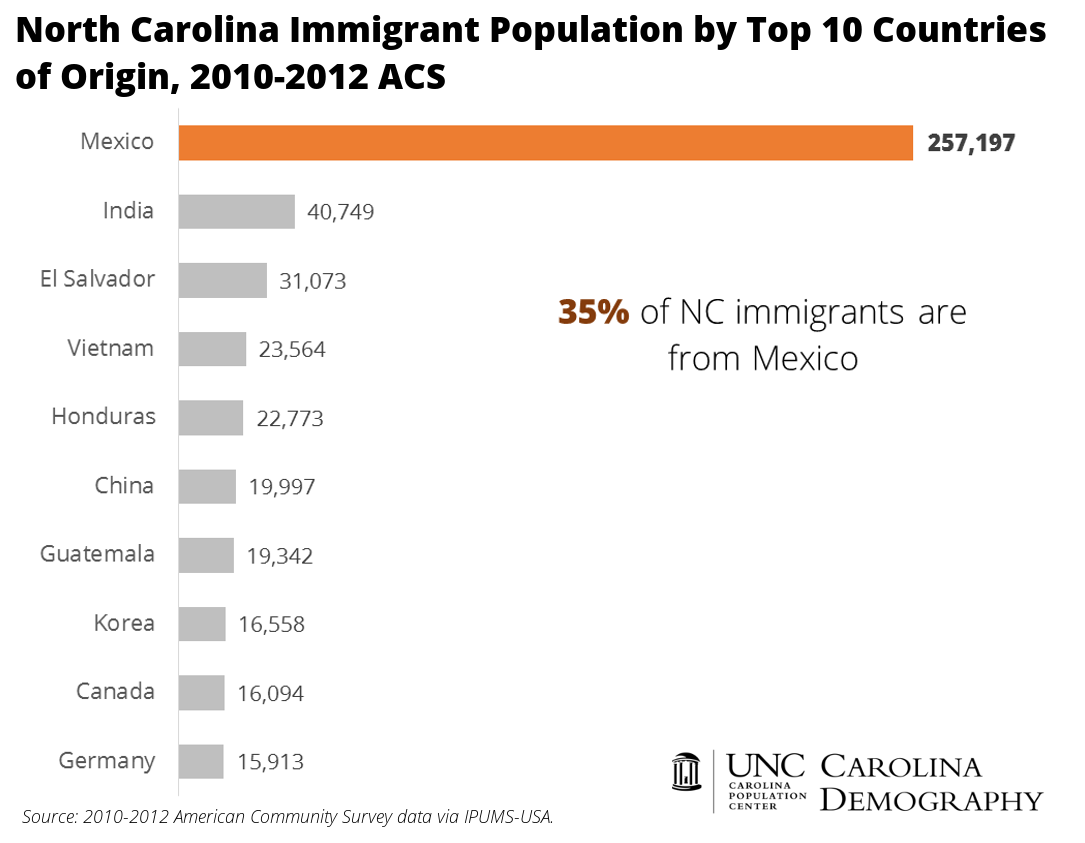 One country—Mexico—has accounted for 30% of all immigrants to the U.S. since 1965. More than a quarter million Mexican immigrants live in North Carolina, representing 35% of all immigrants in the state. The population of Mexican immigrants is more than six times larger than the second largest immigrant group in North Carolina, Indian immigrants.
Migration is driven by many factors. While the specific, individual reasons for migration may vary widely, they often fall into broad, generalizable categories. Demographers, economists, and others studying migration patterns often talk about push-pull processes: individuals are “pushed” from one location by unfavorable conditions and “pulled” into another location by more favorable conditions. But both the desire to migrate—and the ability to migrate—are affected by individual characteristics such as age, sex, and income. As a consequence of these many factors, the characteristics of immigrants living in North Carolina vary widely by country or region of origin.
African immigrants are currently the smallest group, with fewer than 46,000 living in the state. There are a variety of “push” factors in Africa—lack of economic opportunity, civil war, famine—but the cost of immigration to the United States is beyond the reach of many potential African immigrants. Consequently, those who can migrate tend to have higher economic status in their country of origin, reflected in their high educational attainment (92% have a HS diploma) and English language ability (91% speak English well). African immigration has increased rapidly over the past few decades; 87% of North Carolina’s African immigrants arrived in the United States in 1990 or later. The U.S. Census Bureau projects that African immigrants will comprise a growing share of all immigrants in coming years, further increasing population diversity.
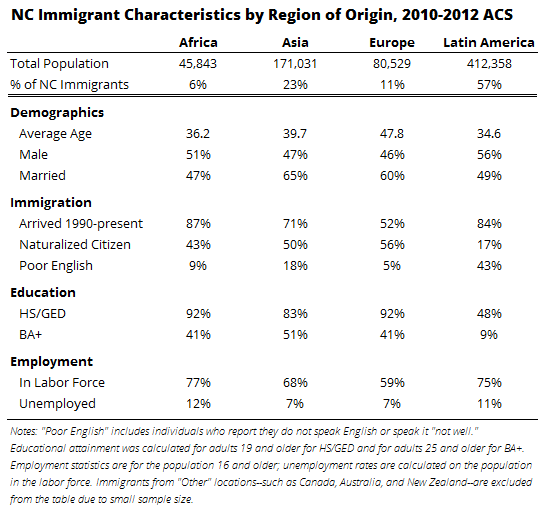 Asian immigrants are the most highly educated group—more than half of Asian immigrants age 25+ have at least a bachelor’s degree—which reflects economic opportunities for highly skilled labor and additional educational opportunities (“pull” factors). However, Asian immigrants also have the second highest proportion of individuals who speak English poorly or not at all (18%) and the second highest proportion of adults without a high school diploma (17%). These may reflect populations that migrated primarily due to “push” factors, such as lack of economic opportunities or ethnic conflict in the country of origin (e.g., Laos).
North Carolina’s European immigrants have been in the U.S. longer than other groups. Nearly half (48%) arrived before 1990, and 19% arrived before 1965. As a consequence, they are, on average, much older (47.8 years) and more likely to be naturalized citizens (56%). Their lower labor force participation (59%) likely reflects the higher proportion of older, retired workers in this population compared to other, younger immigrant groups. Recent European immigrants are much younger, with high educational attainment, suggesting many are migrating for school or work.
Compared to most other immigrant groups, Latin American migrants have high rates of labor force participation (75%), are younger (average age 34.6), more likely to be male (56%), less likely to be married (49%), and much less likely to be naturalized citizens (17%). This may represent a higher likelihood among these immigrants to engage in circular migration, in which large numbers of migrants “move both ways across the U.S.-Mexico border throughout the year, sometimes staying for only a few months.” These may be short-term economic migrants, here to earn and save money for a few months or years before returning to their family in their country of origin.
Migration—both international and domestic—has fueled North Carolina’s growth since 1990. With this population growth has come growing diversity, especially in the child population. Though migration into the state has slowed since the recession, it has not stopped. North Carolina will continue to grow—and grow more diverse—in years to come, as long as the state continues to offer educational and economic opportunities and a quality of life that attract (and keep!) individuals of all ages. The characteristics of future migrants will reflect both the interplay of local push factors with North Carolina’s pull and the capacity of particular individuals to act on the desire to migrate.
Data used in this blog post are from the 2010-2012 American Community Survey data in the Integrated Public Use Microdata Series (IPUMS) from the Minneapolis Population Center at the University of Minnesota.
Your support is critical to our mission of measuring, understanding, and predicting population change and its impact. Donate to Carolina Demography today.