Disability in North Carolina
This Saturday, July 26th, marks the 24th anniversary of the Americans with Disabilities Act, or ADA. The ADA was signed into law by President George H.W. Bush in 1990 and prohibits employers from discriminating against individuals with disabilities. The ADA also mandates accessibility of state and local government services, public accommodations and commercial facilities, transportation, and telecommunications. The purpose of the ADA was to more fully integrate Americans with disabilities into society.
In North Carolina, 1.3 million, or 13.6% of the population, reported a disability in the 2012 American Community Survey. Nearly all North Carolinians with disabilities live in households (94%)—only 6% live in group quarters facilities, such as nursing homes; an additional 1.2 million individuals are not disabled, but share a household with someone who has a disability. In total, 2.5 million North Carolina residents are either directly or indirectly impacted by disability.
While disabilities can occur at any time in a person’s life, they are more common at older ages:
The figure below shows the North Carolina population by age, sex, and disability status. Age is presented in five-year intervals with the male population on the left side of the chart and the female population on the right side. Each bar represents the total size of the population for the given age and sex group. The gray area of the bars represents the population without any disabilities, while the yellow area represents the size of the population living with a disability. The proportion of the bar that is shaded yellow increases with age; for both males and females, more than half of the population aged 80 or older has a disability.
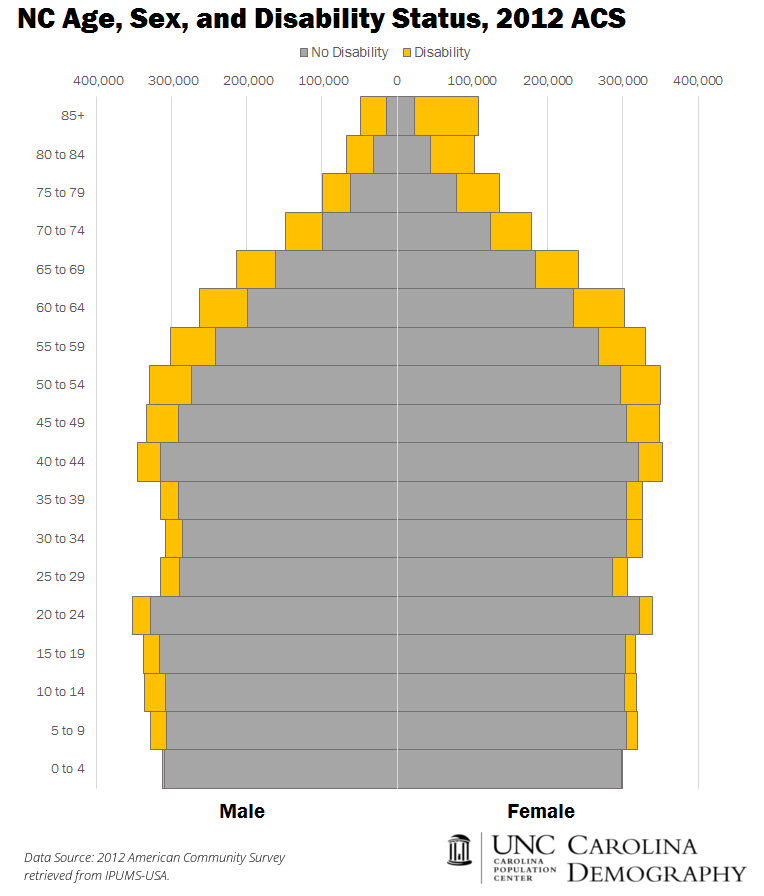
Because women tend to live longer than men—as shown by the larger populations of women in older age groups—and are thus more likely to live to ages where disability is more common, the disability rate among adults is slightly higher for women: 17% of North Carolina’s women ages 18 and older reported a disability in 2012 compared to 16% of men.
Among the 7.8 million North Carolinians 15 and older, 1.24 million (16%) reported at least one disability:
More than half of North Carolinians age 15 and older with a disability (52.2%) reported more than one type of disability: 48% had one disability; 23% had two disabilities; 15% had three disabilities; and 15% had four or more disabilities.
The average individual reported 2 disabilities.
Depending on the type and severity of the disability, individuals with a disability may face significant barriers to full labor market participation. As a consequence, North Carolinians with a disability are less likely to be employed and more likely to fall below the poverty line and rely on assistance programs than individuals without a disability:
Data on the economic characteristics of individuals and households by disability status were retrieved from Social Explorer. All other data were extracted from IPUMS-USA.
Your support is critical to our mission of measuring, understanding, and predicting population change and its impact. Donate to Carolina Demography today.