NC Veterans 2013 Data Snapshot
2013 American Community Survey data estimates more than 681,000 veterans living in North Carolina. This is a notable decrease from 2012, when an estimated 720,500 veterans were living in the state. Since the non-veteran NC population is not decreasing, the proportion of North Carolina veteran residents decreased from 9.8% of the total state population to 9.1% from 2012 to 2013. Click here to view last year’s NC veteran data snapshot.
The decline of North Carolina’s veteran population is part of a nationwide trend, as opposed to an isolated, statewide phenomenon. In fact, the national veteran population declined even more than North Carolina’s population between 2012 and 2013, decreasing 7.7% as opposed to 5.4% in NC. The likely cause of the veteran population decline is mortality, as veterans that served in World War II, Korea, and even Vietnam advance in age.
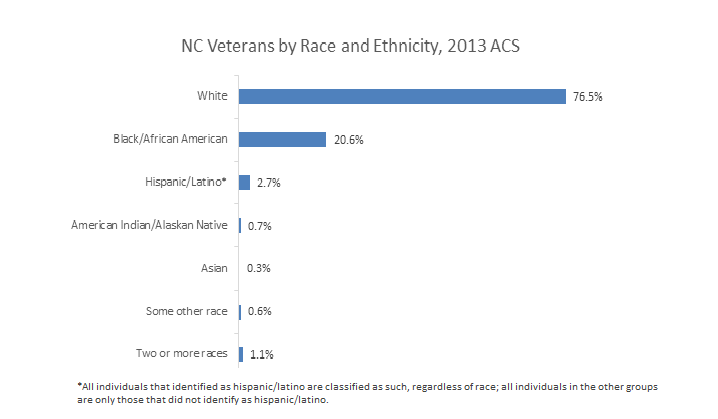
Though the size of the veteran population has decreased, the racial and gender composition of North Carolina’s veterans have not changed significantly. Of NC veterans, 91% are male and 9% are female. Racially, the state’s veteran population is less diverse than the non-veteran population. Although the proportion of black veterans (21%) is similar to the non-veteran proportion, other minorities are significantly underrepresented in the NC veteran population. The proportion of Hispanic/Latino veterans–3%–is less than half of the non-veteran proportion, and the proportion of Asian veterans is barely a tenth of the non-veteran Asian population proportion. Here is the most recent racial breakdown of NC veterans:
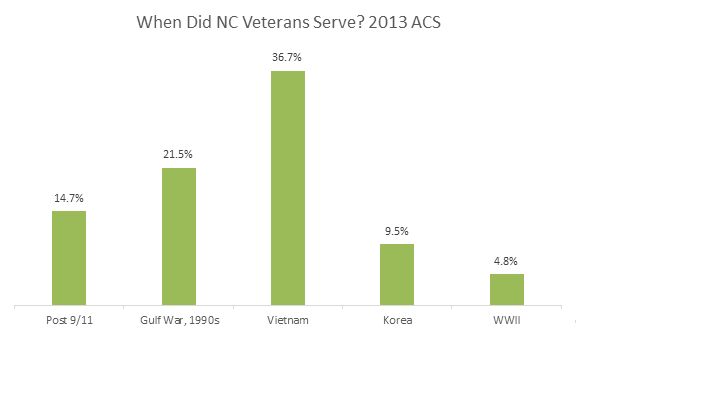
The age structure of the state’s veteran population is increasingly skewed toward older veterans. Almost 44% are 65 and older, and only about 8% are under the age of 35. As time has passed, the proportion of veterans that served during World War II has significantly decreased. Over the last year alone, that proportion of NC veterans who had served during WWII dropped from 6% to 4.8%. This is a sharp contrast to the year 2000, when over 16% of North Carolina’s veterans served only in WWII. This drastic decline is due to the increasing mortality of WWII veterans. The average age of a WWII soldier was 26, meaning that in 2013, the average soldier would be 94 years old if they only served in the final year of the war.
North Carolina veterans have economic differences from the non-veteran population. In fact, on three measures of economic well-being–unemployment, poverty, and median income–veterans in NC report better outcomes than the state’s non-veteran population. The unemployment rate for North Carolina veterans is 9.0% compared to 9.6% among non-veterans. NC veterans also have a lower poverty rate (7.5% for veterans vs. 16.6% for non-veterans) and higher median income ($35,080 for veterans, $23,193 for non-veterans). A variety of social programs contribute to the economic advantages held by veterans, such as income and property tax relief, educational scholarships, and elevated employment consideration. Additional income and medical benefits are available to disabled veterans, who make up over a quarter of the state’s veteran population.
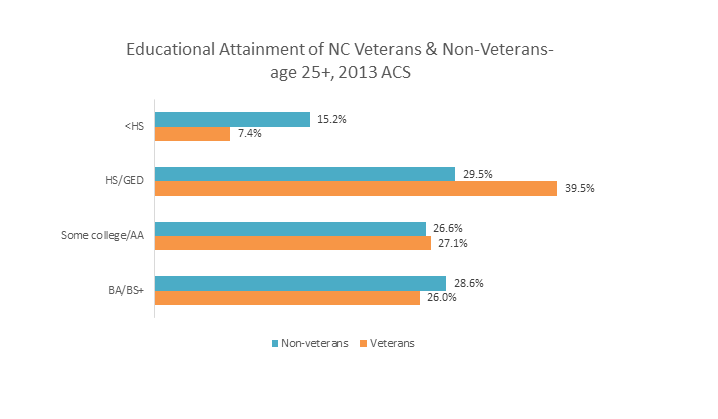
Although non-veterans are slightly more likely to hold a bachelor’s degree or higher, NC veterans are more likely to have attended some college or hold an associate’s degree (65% of veterans) than non-veterans (58.1%), and are significantly less likely to have dropped out of high school (7.4% of veterans, 15.2% of non-veterans).
 The greatest number of NC veterans live in the metro areas of Raleigh, Charlotte, Greensboro, and Fayetteville. Though these places are home to the largest amount of veterans in the state, two places in particular- Jacksonville and Fayetteville- have the highest population proportion of veterans. Jacksonville is home to Marine Base Camp Lejeune, and Fayetteville to Fort Bragg. Both places have a veteran population proportion of about 20%, more than twice as high as the state proportion. The relative location within North Carolina of the state’s veterans is largely unchanged from year to year; a graphic illustrating where veterans live within the state can be found in last year’s veteran data snapshot.
Your support is critical to our mission of measuring, understanding, and predicting population change and its impact. Donate to Carolina Demography today.