May 21, 2015 update: The original post defined compliance for U.S. Congressional Districts as within +/-1%. Although the courts require adherence to equal population as much as possible, the maximum potentially accepted deviation cited elsewhere is a total spread of 1%, meaning +/- 0.5%.
Following the decennial Census, political districts, such as U.S. Congressional districts and state legislative districts, are redrawn in a process called redistricting. The goal is to make each district as close in population size as possible (with a few other considerations, as well). Carolina Demography is working on a broader series about apportionment and redistricting, with an eye to 2020. This will be released later this year. But we also recently did some work with the North Carolina Free Enterprise Foundation about current district population size. NCFEF released this information recently, and I wanted to share it here, as well.
North Carolina’s population has grown substantially in the past few decades, and it continues to grow. At the same time, population is increasingly concentrated in urban cores within the state and rural areas are facing additional population losses due to the impact of population aging. As a consequence of these uneven population changes, many districts were already over or under ideal district size in 2013, in spite of best efforts to ensure equal population during the redistricting process. Before diving into the data, I want to define two things: ideal size and compliance.
Ideal size is equal population across districts. Mathematically, you can calculate it for any given set of districts by taking the state’s population and dividing by the total number of districts. For example, in 2013, the U.S. Census Bureau estimated that North Carolina’s population was 9,848,060. Dividing by 13 U.S. House Districts yields an ideal district size of 757,543 for each of North Carolina’s U.S. House District in 2013.
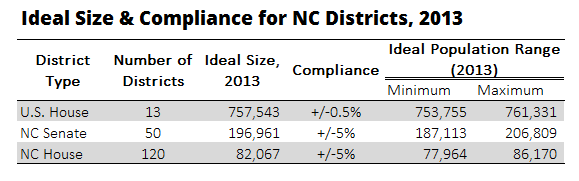
Compliance defines the range of acceptable deviation from ideal size. U.S. House Districts must be drawn within 0.5% of ideal size (spread of 1% total), while state legislative districts can be drawn within 5% of ideal size (10% total spread). In the post-2010 redistricting process, the U.S. House seats were virtually identical, ranging from 733,498 to 733,499 in total population. The North Carolina Senate and House seats had a wider range, however, ranging from 5% below ideal to 5% over ideal size across the districts. This is in part because other considerations, such as keeping counties intact, come into play when drawing state House and Senate districts.
As the state’s population increases, the ideal district size increases. This means that districts that are growing, but at a slower rate than the state as a whole, may fall below the lower boundary for ideal district size over time. Districts that are growing at a faster pace than the state as a whole may rise above the maximum ideal district size over the decade. Disparate growth patterns across the state means that many districts had populations outside of the range of compliance in 2013.
Which districts were out of compliance? To calculate deviation from ideal district sizes, we used the 2013 American Community Survey (ACS) estimates for the population of the U.S. House Districts. For the NC Senate and NC House districts, we developed a custom data set and methodology.*
The ideal district size for North Carolina’s 13 U.S. House districts was 757,543 in 2013. Twelve of the 13 districts were out of compliance according to the 2013 ACS estimates, meaning that they deviated from the ideal size by 0.5% or more in either direction. Only District 6 was within the ideal population range. Although only one district—District 1 in eastern North Carolina—lost population between 2010 and 2013, six districts—1, 3, 5, 8, 10, and 11—were under the ideal district size.
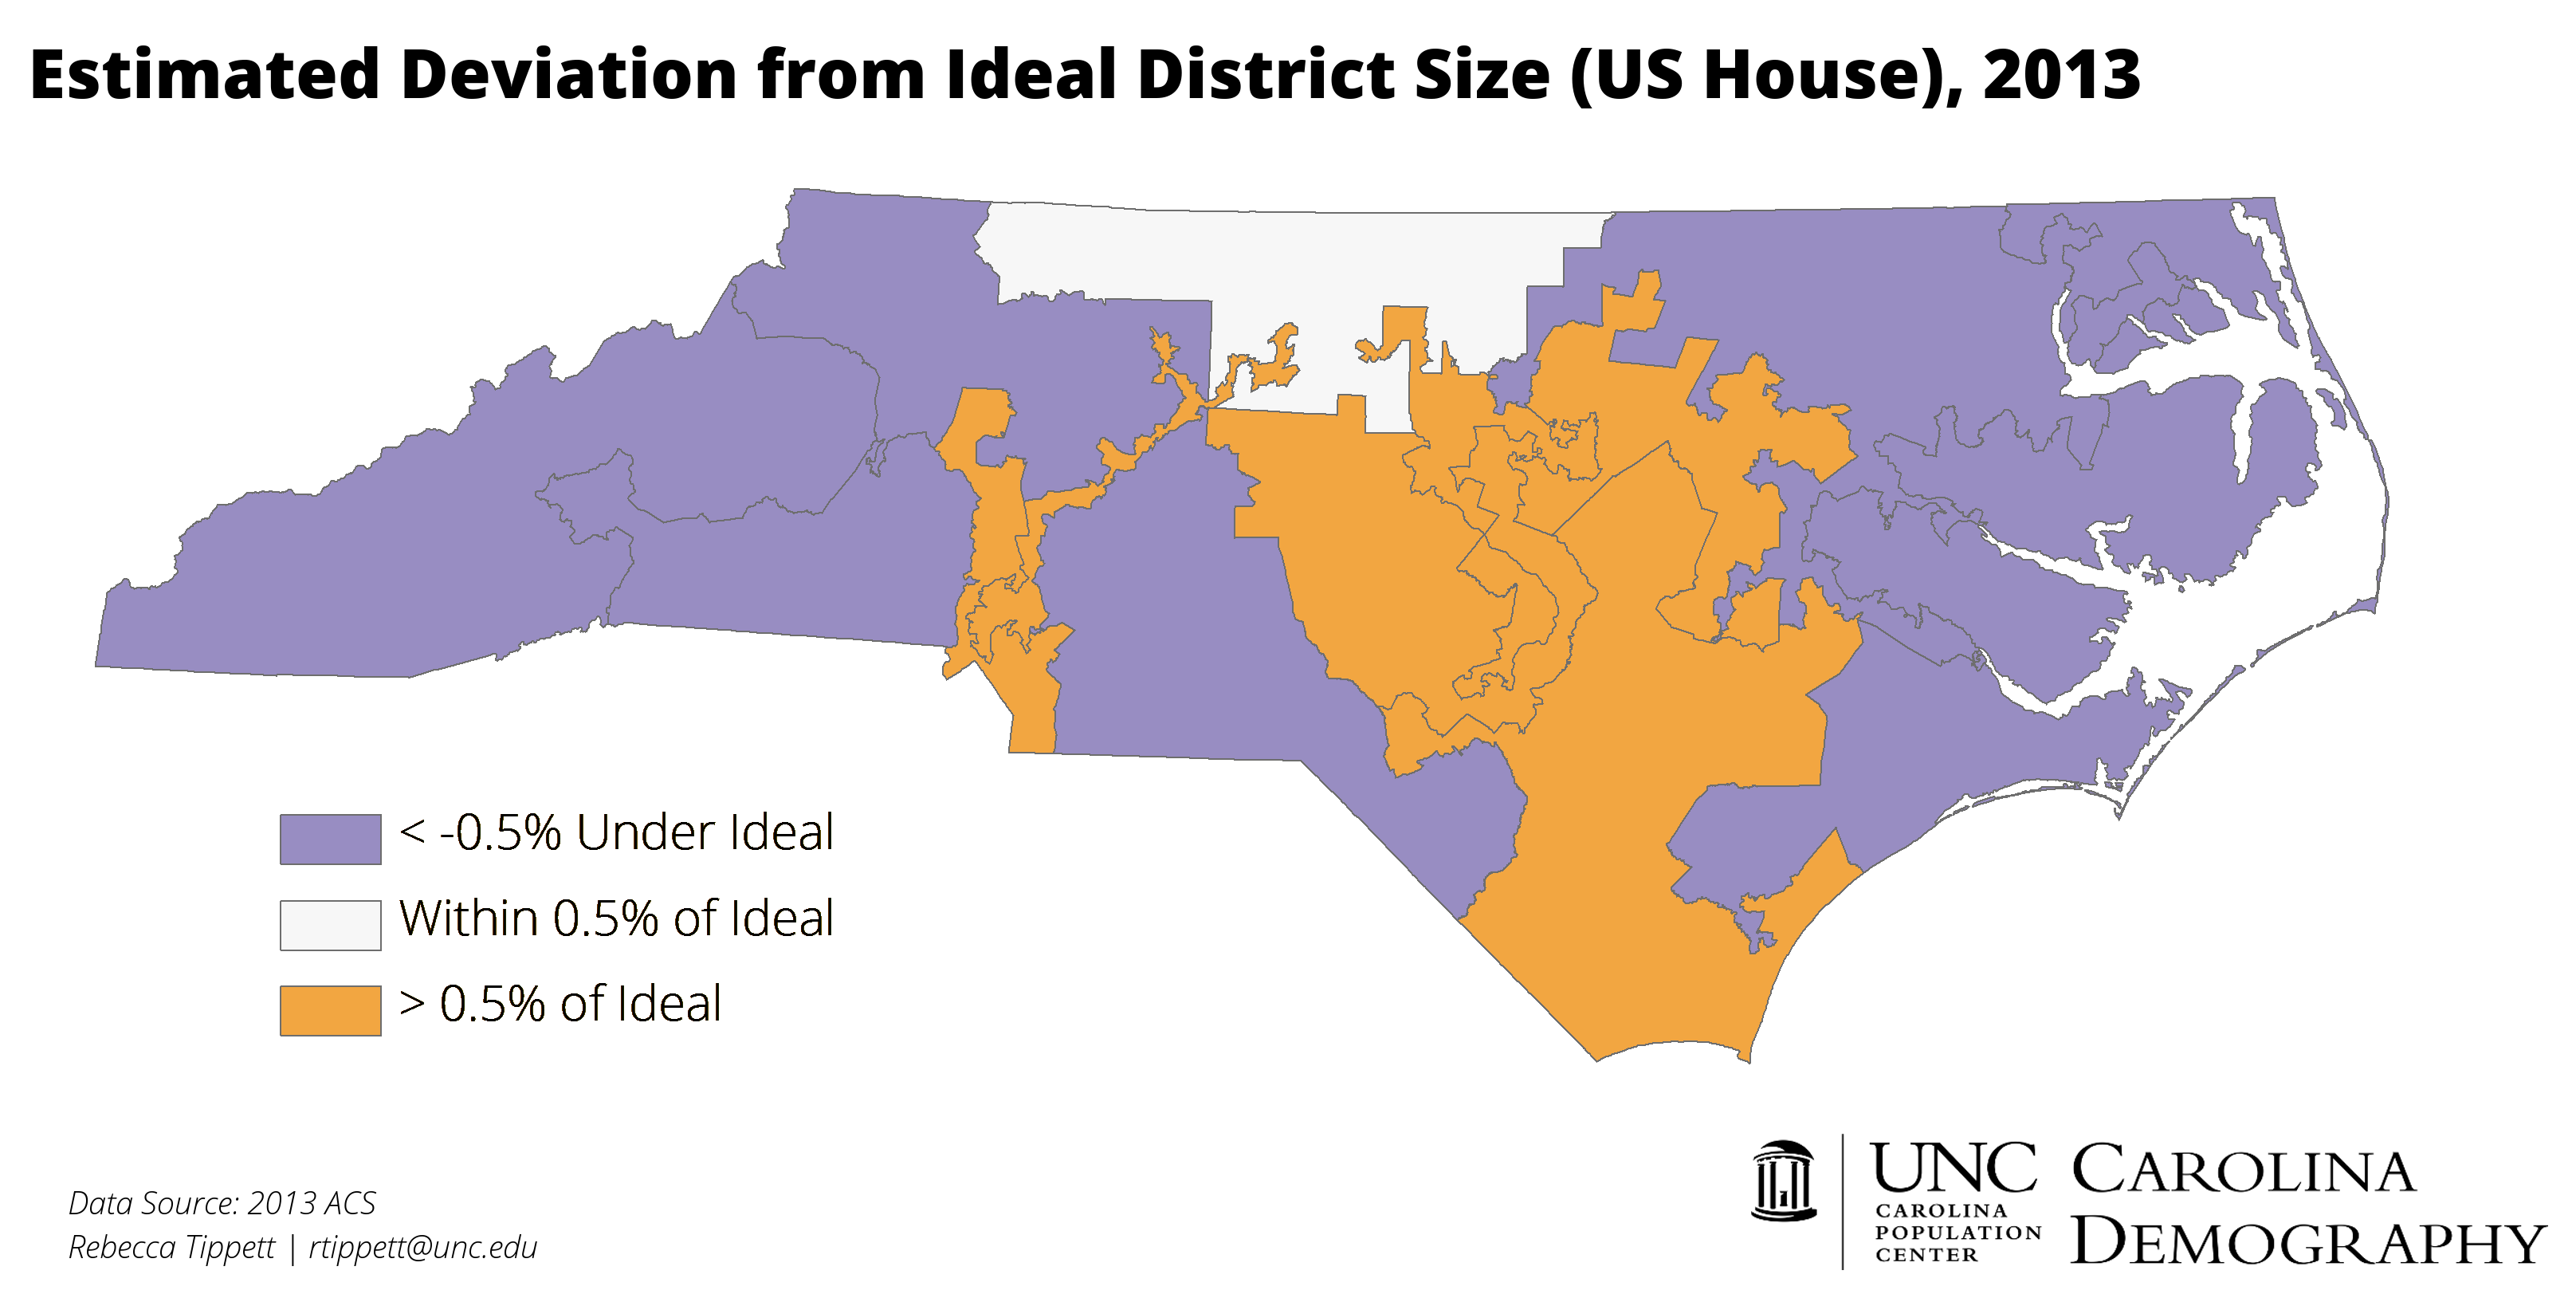
At the same time, more rapid growth in urban areas pushed six districts—2, 4, 7, 9, 12, and 13—over ideal district size as of 2013.
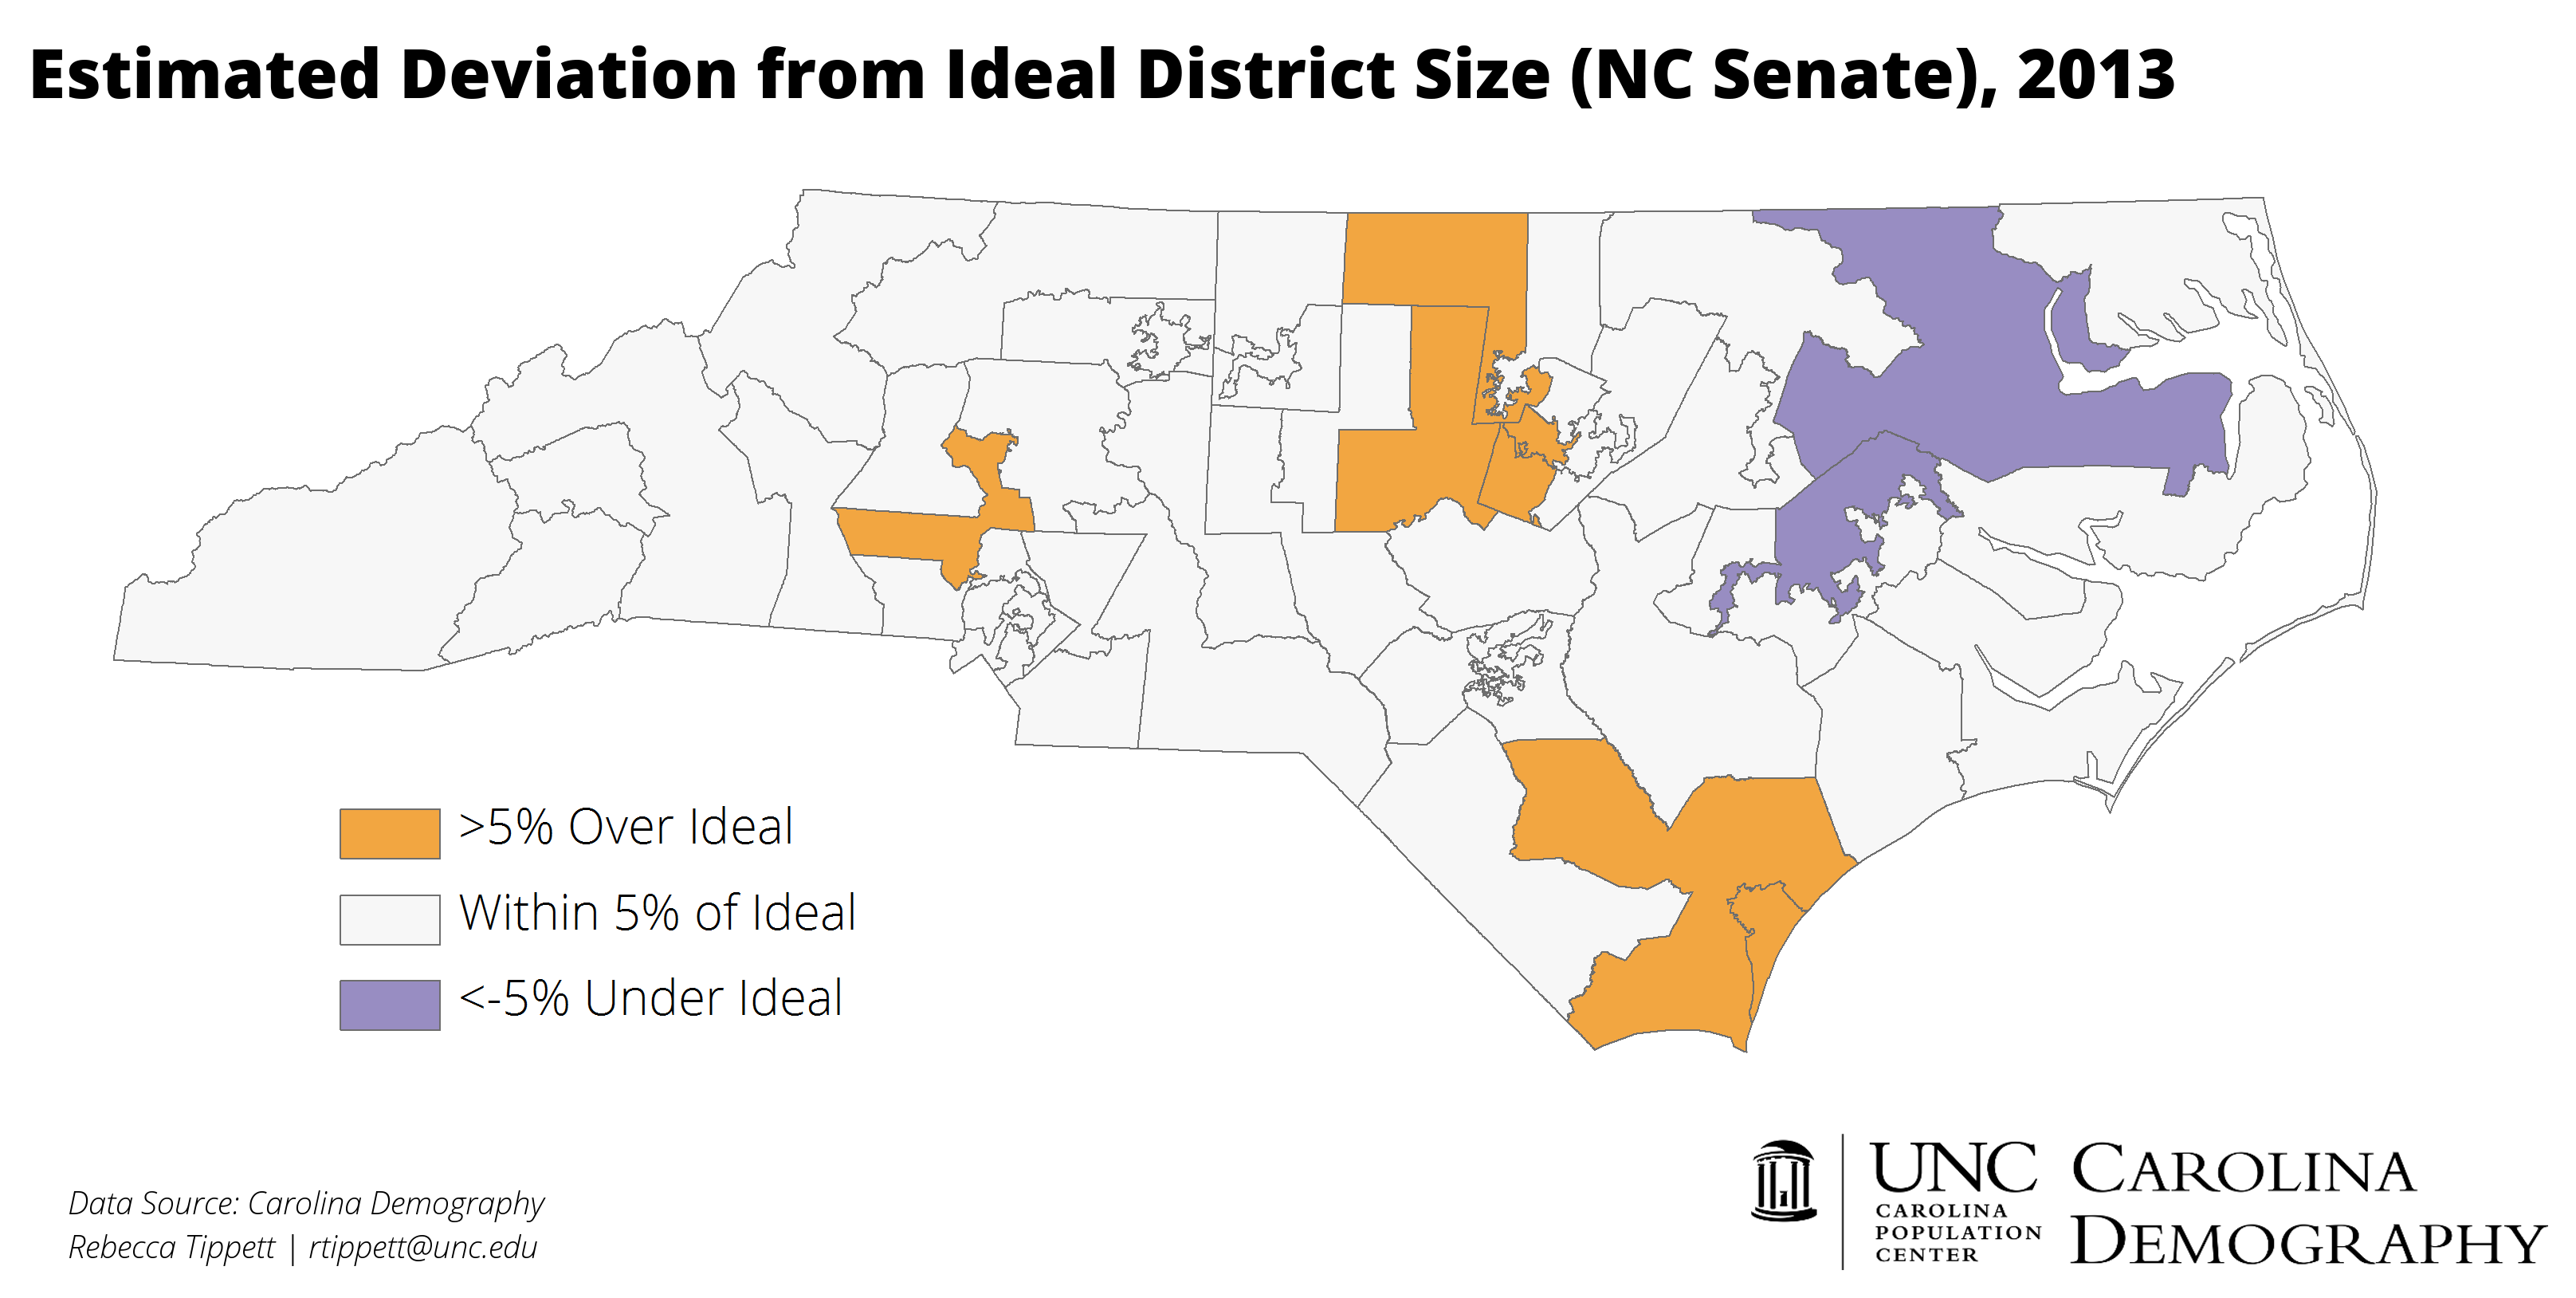
NC Senate
The ideal district size for North Carolina’s 50 state Senate districts was 196,961 in 2013. Nine of the 50 districts already deviated from ideal size by more than 5% in either direction according to our 2013 estimates. Two districts (3 and 5) fell more than 5% below ideal size. Seven NC Senate districts—8, 9, 16, 17, 22, 23, and 44—were estimated to have a total population more than 5% above ideal district size in 2013.
The ideal district size for North Carolina’s 120 state House districts was 82,067 in 2013. As of 2013, more than one-third (44) of the state’s 120 districts deviated 5% or more from ideal size. Half of the districts out of compliance were more than 5% under the ideal size, while half were 5% over ideal size.

These maps highlight the impact of population change between 2010 and 2013. Unless current population growth trends change in significant and unexpected directions, these patterns will intensify through 2020, bringing significant changes to the state’s legislative maps during the redistricting process.
*Please contact Dr. Rebecca Tippett at (919) 962-6151 or rtippett@unc.edu for more details about the NC House and Senate District estimates created by Carolina Demography.
Don’t miss our upcoming series on Apportionment & Redistricting – subscribe to our mailing list:
Your support is critical to our mission of measuring, understanding, and predicting population change and its impact. Donate to Carolina Demography today.