NC in Focus: Veteran Population, 2015
The U.S. Census Bureau’s American Community Survey contains detailed data about our nation’s veterans, their demographic characteristics, their social lives, and their economic well-being. This is the data we have used in previous snapshots of North Carolina’s veterans (here and here). Additional data on the veteran population is produced by the U.S. Department of Veterans Affairs (VA). The VA produces projections of the veteran population through 2043. In addition to total veteran population, they provide demographic details of the veteran population at various geographic levels (nation, state, and county). Today’s post highlights some of the insights from the VA data.
According to the VA projections, there were 773,884 veterans living in North Carolina as of September 30th, 2015. Nearly 30% of the state’s veteran population lived in one of five counties: Wake (58,237), Mecklenburg (56,812), Cumberland (50,010), Guilford (32,533), or Onslow (30,329).
Statewide, this represented nearly 10% of North Carolina’s adult (18+) population. This share was significantly higher in Onslow (21.7%), Cumberland (20.6%), Hoke (19.5%), Craven (18.7%), and Currituck (15.7%) counties.
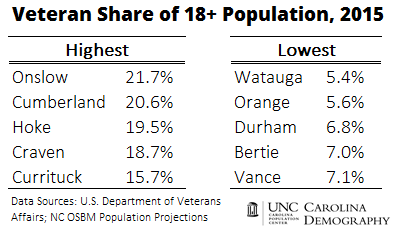
The counties with the lowest share of veterans among the adult population were Watauga (5.4%), Orange (5.6%), Durham (6.8%), Bertie (7%), and Vance (7.1%). The presence of universities in Watauga (ASU), Orange (UNC-CH), and Durham (Duke) likely impacts these lower shares.
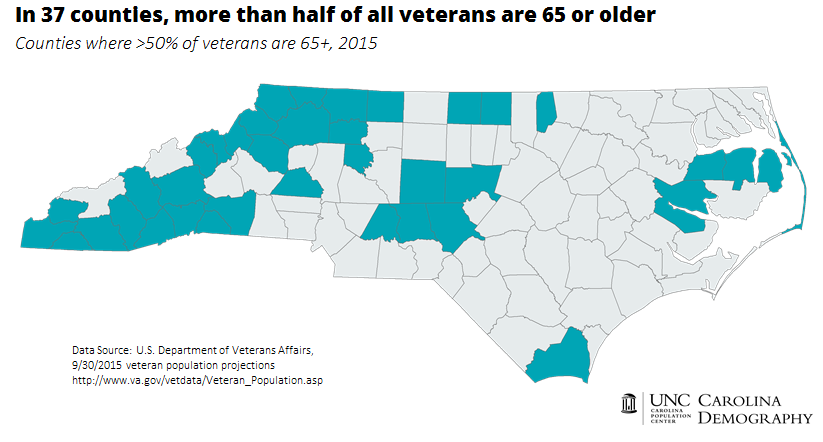
In 2015, the VA projected that 23% of North Carolina’s veterans were younger than 45, 35% were between the ages of 45 and 64, and 41% were 65 or older. This age breakdown varies across counties. In Onslow and Hoke, for example, more than half of all veterans are younger than 45, a proportion more than double the statewide rate. In contrast, there are 37 counties where at least half of all veterans are 65 or older.
The veteran population in North Carolina—and in the nation—is older than the overall population. Reflecting this age structure, the VA model projects a steady decline in the size of the veteran population through 2043.
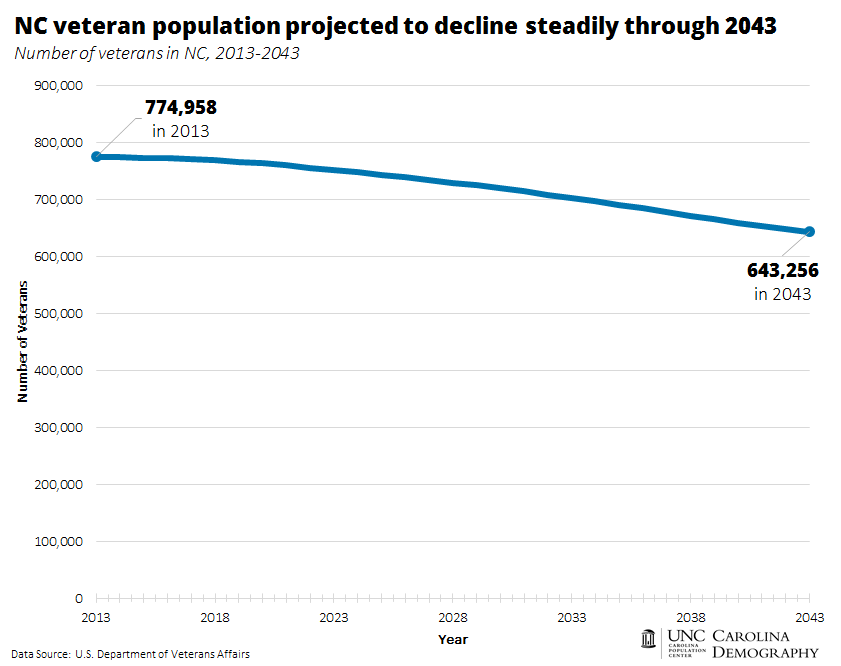
Between 2013 and 2043, North Carolina’s veteran population is projected to decline from about 775,000 veterans to just over 643,000. This represents a decrease of nearly 132,000 individuals or a loss of 17%. Total declines of U.S. veterans are projected to be even more significant. In 2013, the VA estimated that there were 22.3 million living U.S. veterans (including those living in other countries). This number is projected to shrink to 14.5 million by 2043, a loss of 7.8 million or 35%.
Note: The VA data uses a different methodology from the ACS estimates. As such, the numbers in the ACS and the VA differ.
Your support is critical to our mission of measuring, understanding, and predicting population change and its impact. Donate to Carolina Demography today.