Following the decennial Census, political districts, such as U.S. Congressional Districts and state legislative districts, are reapportioned to states and counties on the basis of population and their boundaries are redrawn in a process called redistricting. Broadly speaking, the goal of redistricting is to make each district as close in population size in possible.
While North Carolina’s population growth continues to outpace the nation, this growth is concentrated in the state’s urban areas. Nearly half of the state’s population growth since 2010 has occurred in two counties—Wake and Mecklenburg. Over this same time period, 49 of the state’s 100 counties have lost population. Today’s post explores the implications of these population shifts on the state’s legislative districts.
Annual population estimates for U.S. Congressional Districts are available through the U.S. Census Bureau’s American Community Survey (ACS). The most recently available year is 2014 and can be accessed here.
Details for state legislative districts—the North Carolina House and Senate—are only available in the 5-year ACS data, not the 1-year data. This means that the most recent data from the U.S. Census Bureau are from 2010-2014, and are not directly comparable to the 2014 population estimates. To overcome this limitation, we used our neighborhood change dataset (built at the tabulation block level) and developed a methodology to produce 2014 population estimates for state legislative districts. Additional details on the data and methodology used to produce these estimates are available here.
Ideal population size is equal population across districts. Mathematically, this is calculated by taking the state’s population and dividing by the total number of districts. For example, the U.S. Census Bureau estimated that North Carolina had 9,943,964 residents as of July 1, 2014. Divided among 50 NC Senate districts, this yields an ideal population size of 198,879 per district.
Compliance defines the range of acceptable deviation from ideal size. While U.S. House Districts typically are drawn to be precisely equal, we have allowed for a potential maximum allowable deviation of 0.5% from ideal size (a spread of 1% total). There is more flexibility for state legislative districts; they must be within 5% of ideal size (a spread of 10% total).
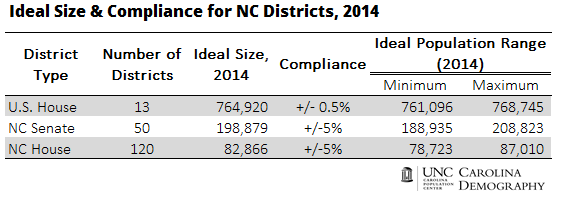
Because the number of legislative districts is currently fixed at 50 state Senate seats and 120 state House seats, the ideal district size increases as the state’s population grows. This means that districts that are growing, but at a slower rate than the state as a whole, may fall below the lower boundary for ideal district size by 2020. Districts growing at a faster pace than the state as a whole may rise above the maximum ideal size over the decade. Population estimates for 2014 suggest that many of the state’s legislative districts are already outside of the range of compliance.
The ideal district size for North Carolina’s 13 U.S. House districts was 764,920 in 2014. All 13 districts were out of compliance according to the 2014 ACS estimates, meaning that they deviated from the ideal size by more than 0.5% in either direction.
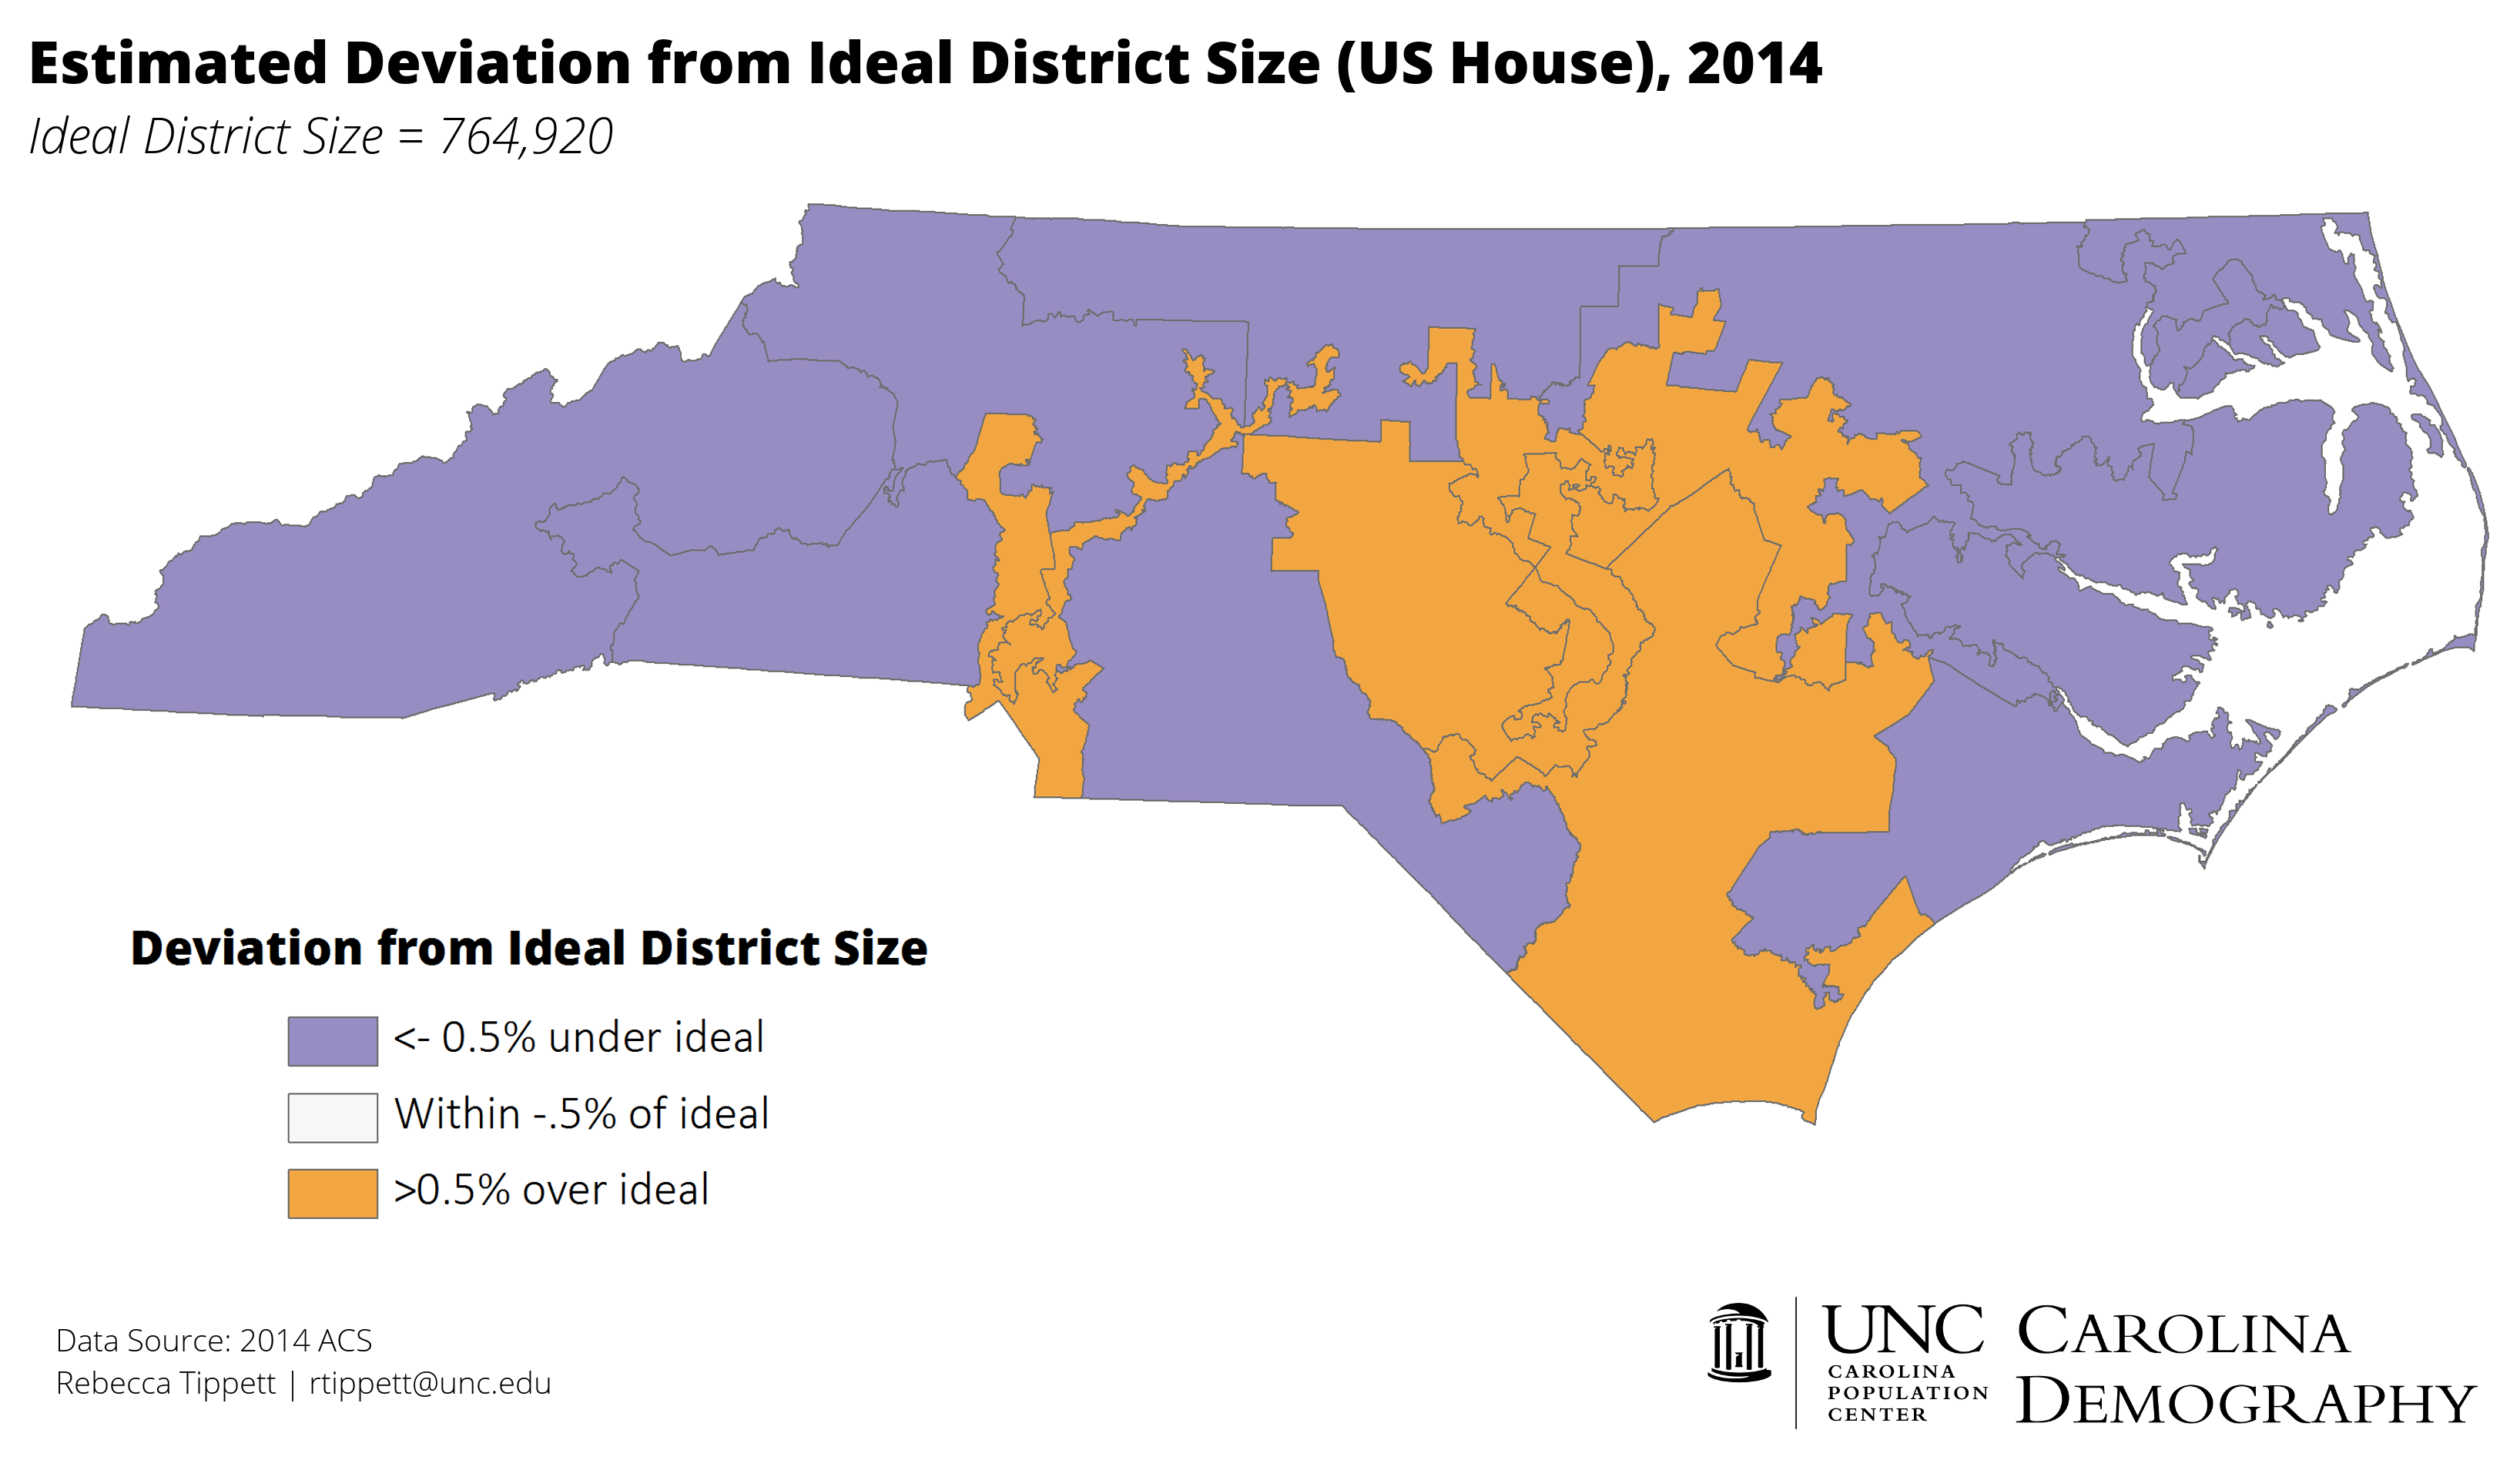
Although none of the state’s 13 congressional districts lost population between 2010 and 2014, seven districts fell below ideal size as of 2014. In contrast, six districts, covering much of the state’s urban corridor, from Charlotte to the Triangle and down to Wilmington, were above ideal population size.
The slowest growing district between 2010 and 2014 was District 1, located primarily in northeastern North Carolina. It has gained just over 9,000 new residents since 2010, a growth rate of 1.3%. In contrast, District 9, containing parts of Mecklenburg and Iredell counties, was the fastest growing congressional district. Since 2010, it has grown by 9.9%, gaining nearly 72,500 new residents.
The ideal district size for North Carolina’s 50 state Senate districts was 198,879 in 2014. Seventeen districts—34% of all Senate seats—deviated from ideal size by more than 5% in either direction according to our 2014 population estimates. Nine Senate districts had too few people; 8 had too many people.
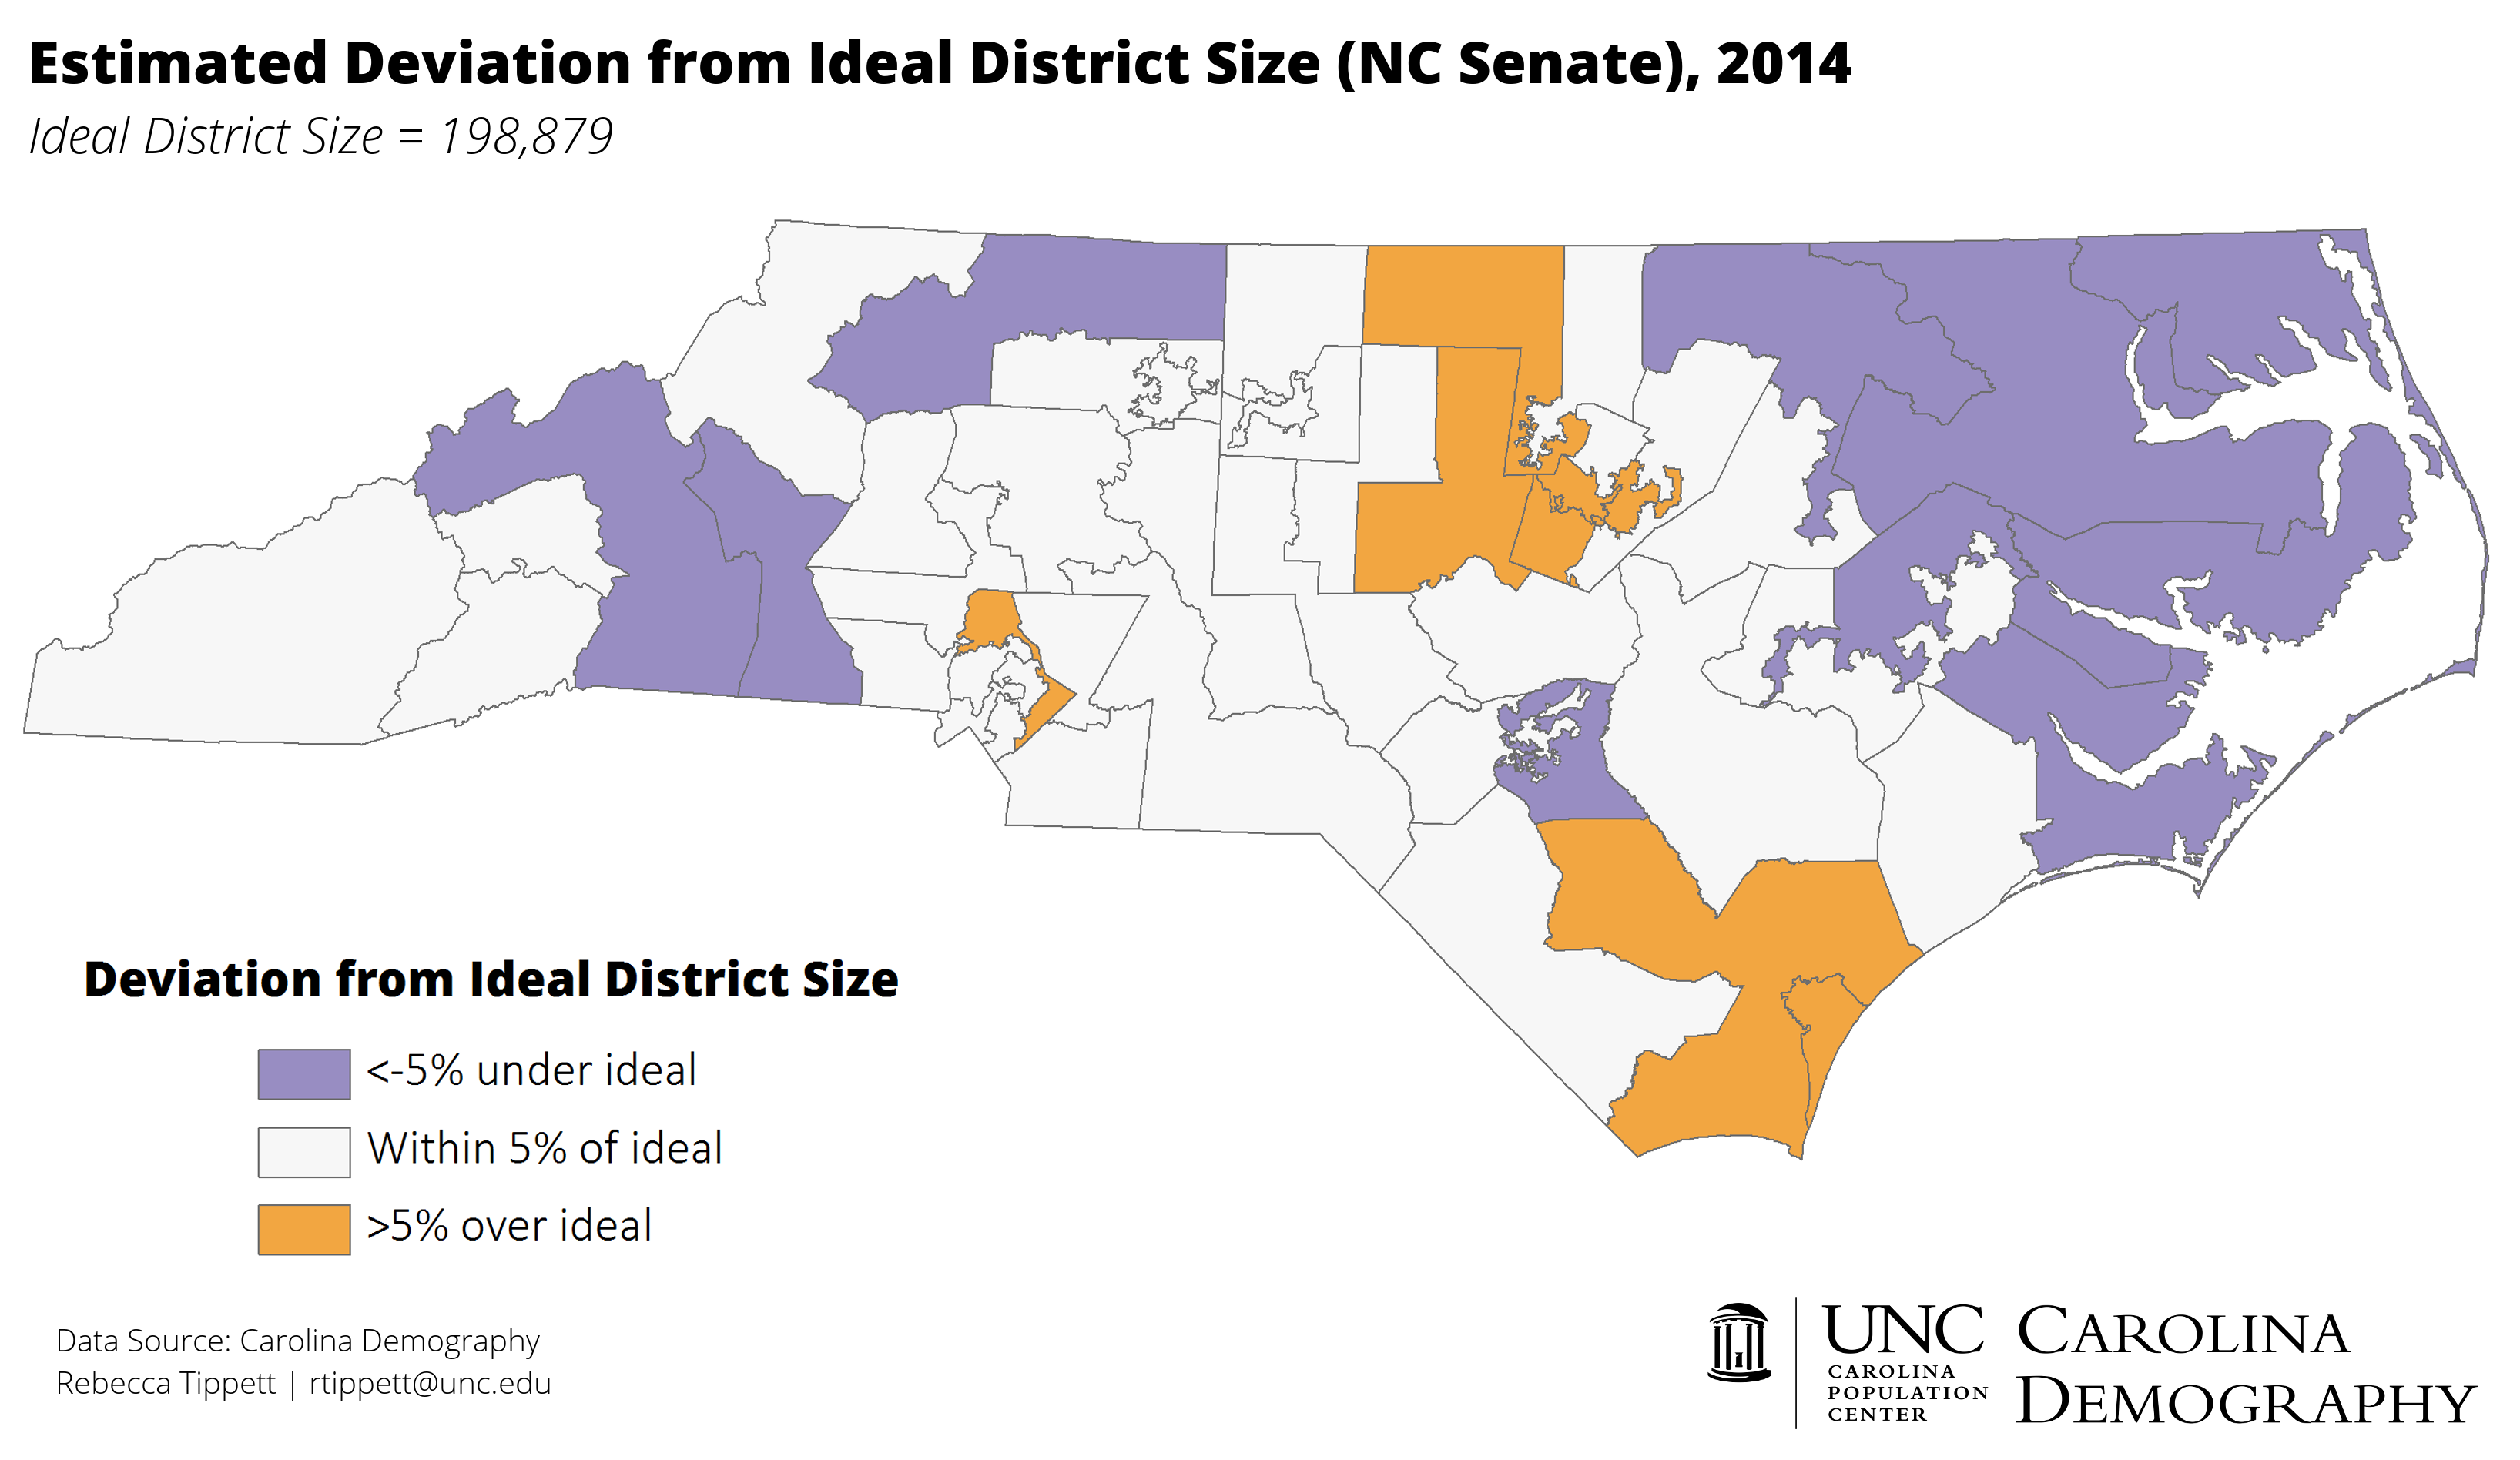
The NC Senate district with the fastest estimated growth between 2010 and 2014 was District 41 in Mecklenburg County (Jeff Tarte). Senate District 41 has gained 28,600 new residents since 2010, an increase of 15.7%.
In contrast, the largest population losses occurred in NC Senate District 3 (Erica Smith-Ingram), which includes all or part of Bertie, Chowan, Edgecombe, Hertford, Martin, Northampton, Tyrrell, and Washington counties. District 3 lost 7,000 residents since 2010, a decline of 3.9%. Fueled by these population losses, District 3 fell the furthest under ideal population size in 2014. With an estimated population of 174,521, District 3’s population was -24,400 or -12.2% beneath ideal district size.
District 17 in Wake County (Tamara Barringer) had the largest deviation above ideal population size in 2014. With an estimated population of more than 221,800, District 17 was nearly 23,000 or 11.5% above ideal size.
The ideal district size for North Carolina’s 120 state House districts was 82,866 in 2014. Fifty districts—42% of all state House seats—deviated from ideal size by more than 5% in either direction according to our 2014 population estimates. Twenty-six House districts had too few people; 24 had too many people.
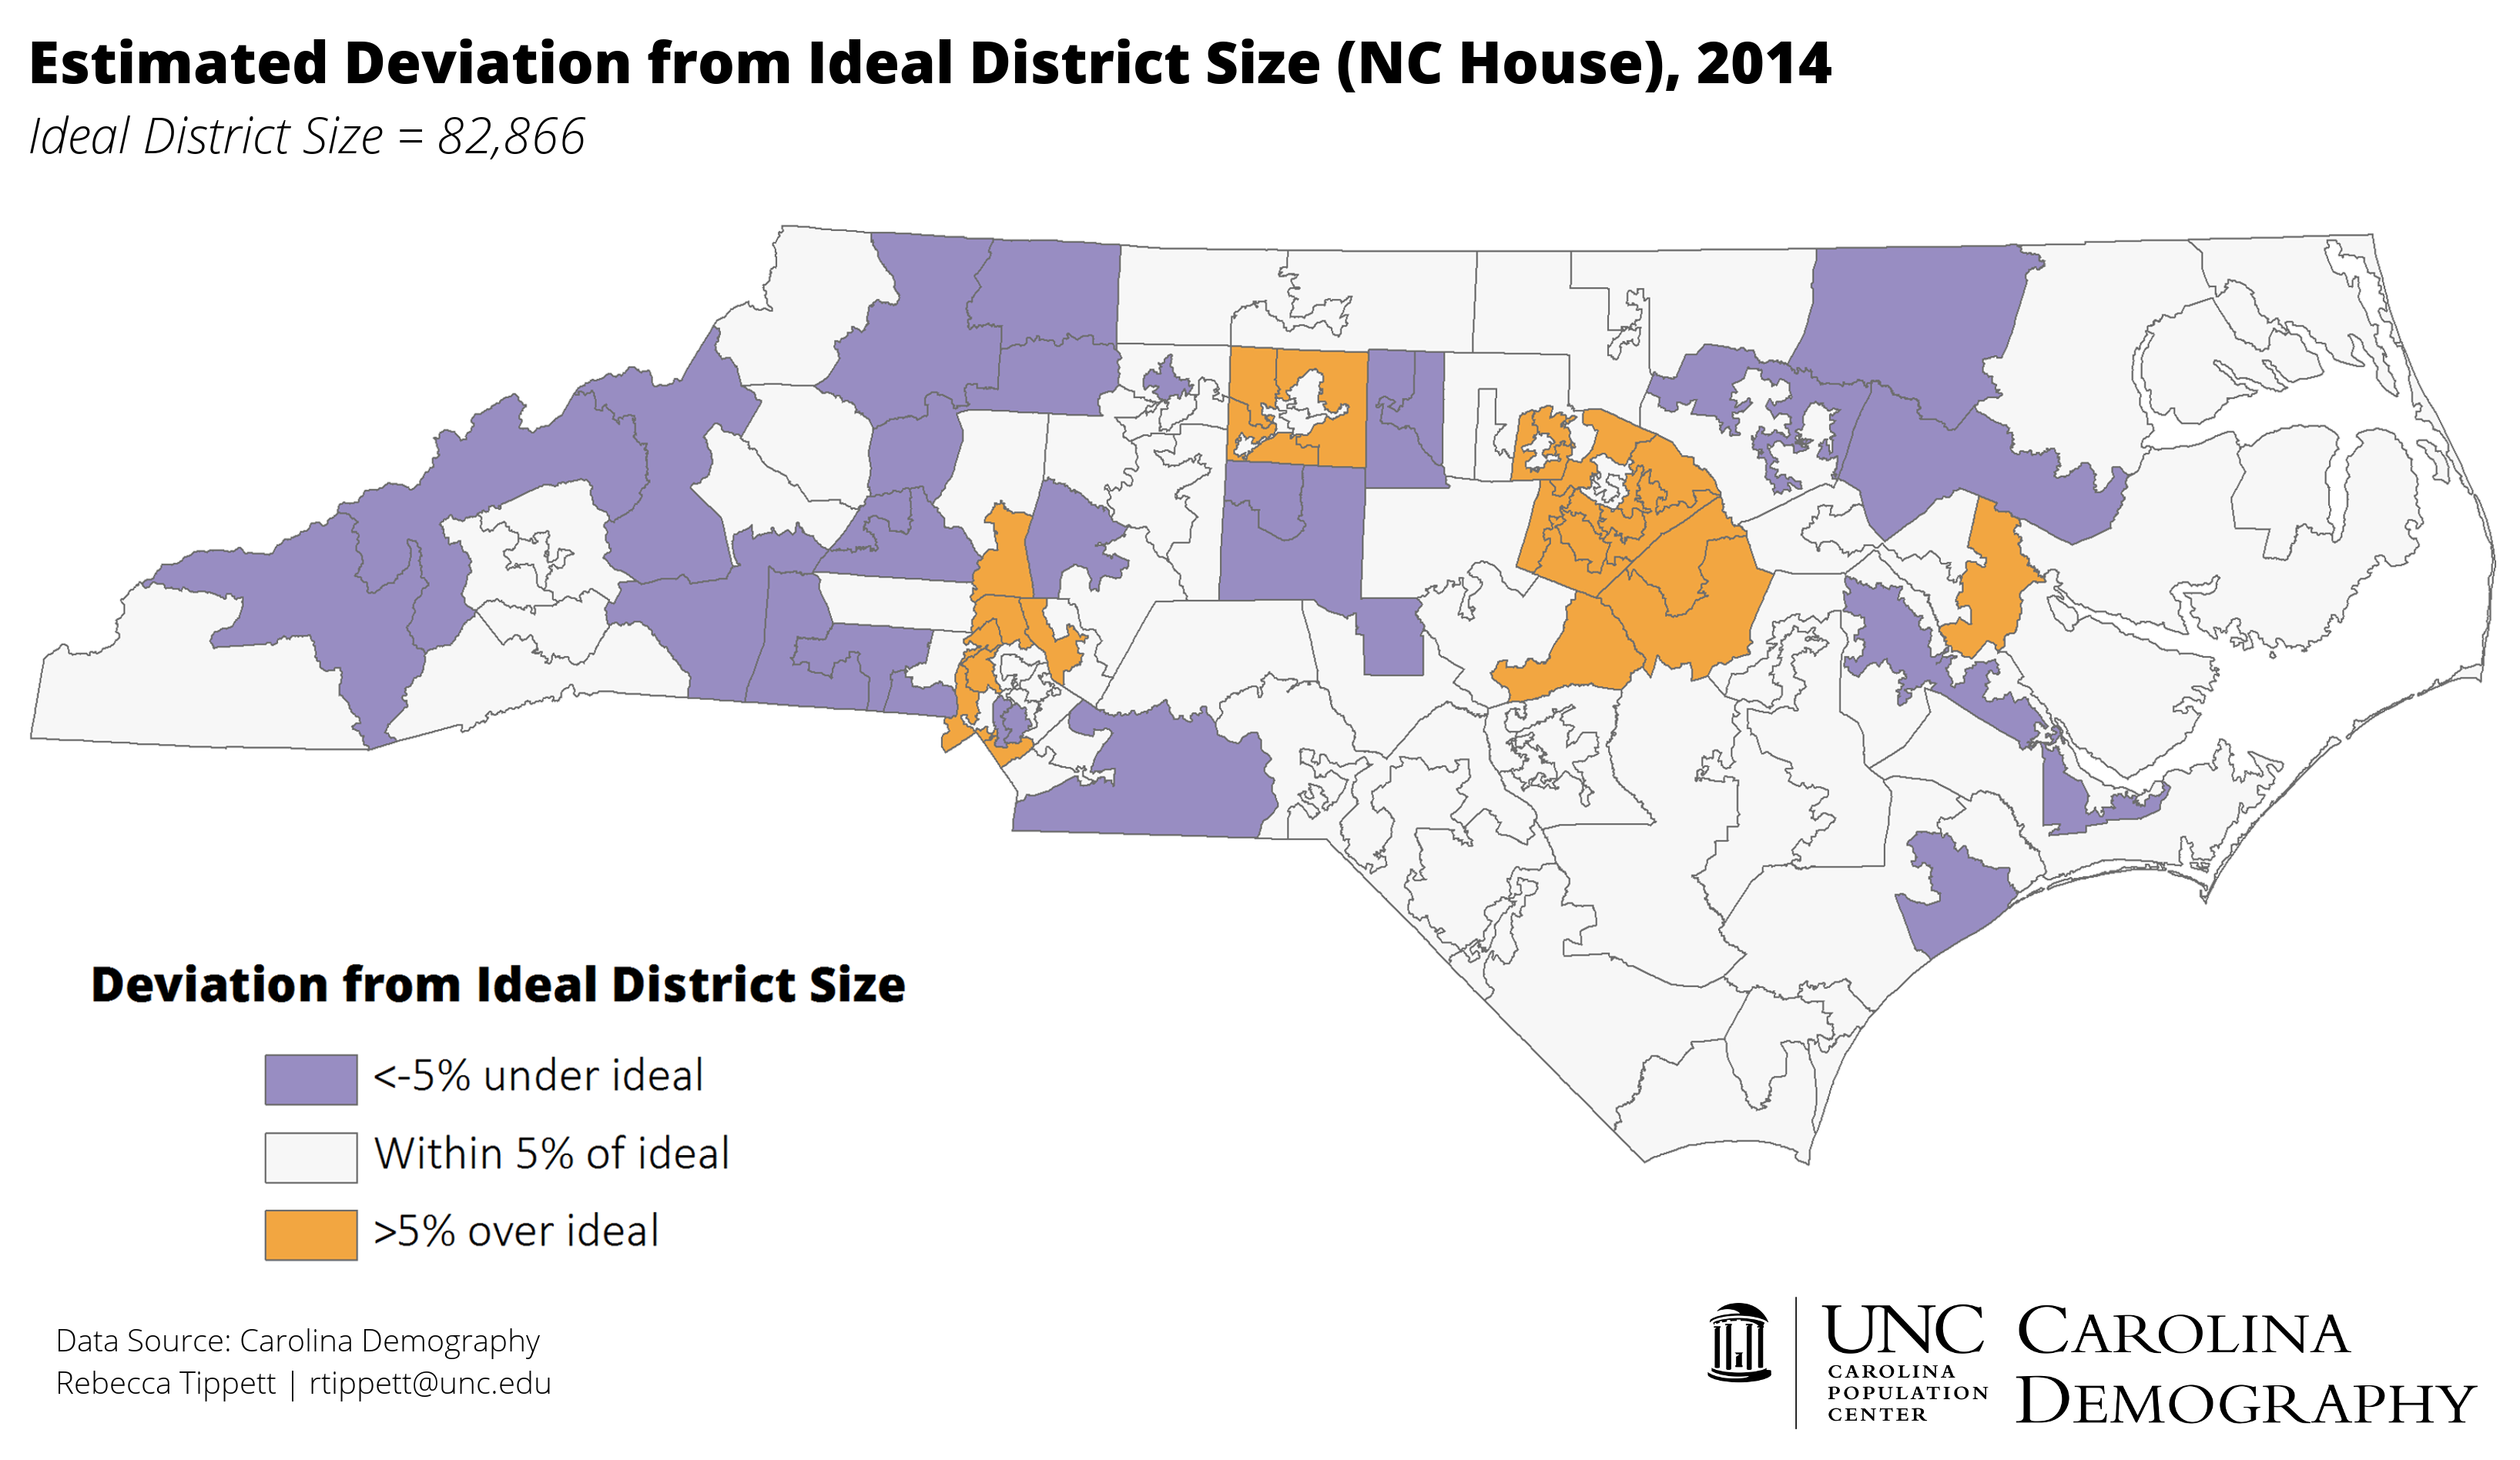
Like the NC Senate, the NC House district with the fastest estimated growth between 2010 and 2014 was also in Mecklenburg: District 92 (Charles Jeter). District 92 grew by an estimated 19.5% between 2010 and 2014, gaining nearly 15,200 new residents. House District 41 in Wake County (Gale Adcock) gained the same number of new residents as District 92, but had a slower growth rate (18.3%) due to a higher 2010 population. As of 2014, District 41 had the largest deviation above ideal district size: its estimated population of 98,000 residents was more than 15,000 or 18.3% above ideal district size.
North Carolina House District 27 (Michael H. Wray), located in Halifax and Northampton counties, was the slowest growing House district between 2010 and 2014. With a growth rate of -4.4%, District 27 also saw the largest population losses since 2010 (-3,400). Due to these losses, District 27 fell the furthest below ideal district size in 2014. With an estimated population of 73,433, District 27 was -9,400 or -11.4% below ideal size.
Your support is critical to our mission of measuring, understanding, and predicting population change and its impact. Donate to Carolina Demography today.