Based on the recent candidate filings, we can classify North Carolina’s 50 state senate districts into one of three types: Democratic candidate(s) only, Republican candidate(s) only, and at least one candidate from both major political parties. (Although some districts do have Libertarian candidates on the ballot, this analysis focuses only on candidates from the two major political parties.)
Thirty-two of the state’s 50 senate seats, or 64%, have at least one Republican and one Democrat registered for the 2016 election. Thirteen or 26% of the state senate seats have only one candidate running: 4 Democrat and 9 Republican. In five other state senate districts, only one of the major political parties represented: two districts have only Republicans running, two have both a Democratic and Libertarian candidate registered, and one district has two Republicans and one Libertarian registered. Overall, there are 6 senate districts where Democrats are the only major political party represented, 12 districts where Republicans are the only major political party represented, and 32 where candidates from both parties will be on the ballot in November.
Among North Carolina’s 5.2 million active, registered voters, 41% are registered Democrats, 32% are registered Republicans, and 27% are unaffiliated. The chart below highlights how the overall partisan composition of voters varies by candidate affiliation.
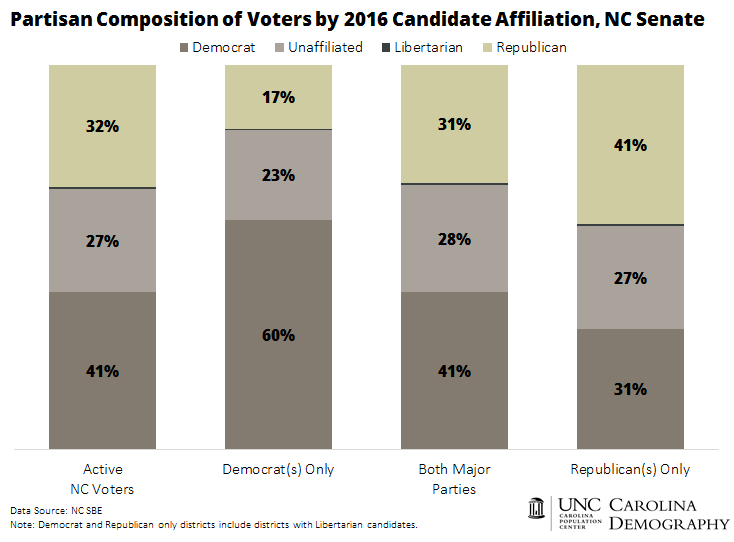
In aggregate, the partisan affiliation of registered voters in the 32 state senate districts with candidates from both major parties is nearly identical to the statewide statistics for voter registration. The six districts with only Democratic candidates have a much higher share of Democratic voters than the state, 60% vs. 41%. Similarly, the twelve districts with only Republican candidates have a higher share of Republican registered voters, 41% vs. 32% statewide.
These patterns suggest that highly partisan districts are less likely to have challenges from the non-dominant party, although this is not always the case. The graph below shows a scatterplot of the state’s 50 senate districts in which the district’s share of Democratic registered voters is plotted against its share of registered Republican voters. Generally speaking, the share of Republican registered voters increases as the share of Democratic registered voters decreases. The relationship is not perfectly linear—that is, declines in Democratic voter share do not always yield equal increases in Republican voter share—due to district variations in the share of voters who are unaffiliated with either political party.
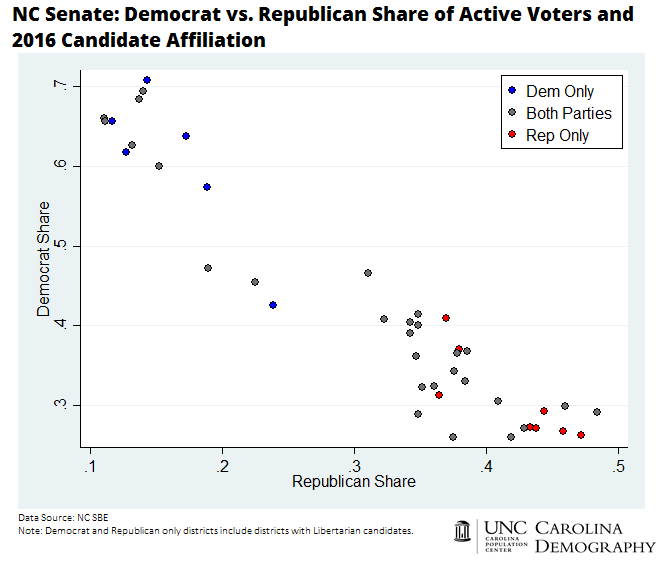
The color of the dots represents the candidate affiliation for each district. Blue dots are districts with only Democratic candidates, red dots represent districts with only Republican candidates, and gray dots represent districts with candidates from both major parties. The cluster of the gray dots near the middle of the graph represents the senate districts where the partisan composition of the voters most closely resembles the state—districts with 30-36% Republican voters and 30-45% Democratic voters. All of these districts have candidates from both parties. As the concentration of Republican voters shifts towards 40% or more, districts are more likely to have only Republican candidates. Similarly, as the concentration of Democrats shifts above 50%, districts are more likely to have only Democratic candidates.
Although highly partisan senate districts are less likely to have the non-dominant party represented, many of these districts do have challengers from the other party for 2016. Whether these are serious threats or largely “quixotic affair[s]” cannot be shown in a scatterplot and may vary from race to race, reflecting specific, local concerns and candidate characteristics. Of the 11 senate districts where more than 50% of voters are registered Democrat, six have both Republican and Democratic candidates: 4, 13, 21, 28, 38, and 40. Among state senate districts where more than 40% of voters are registered Republican, districts 30, 33, 39, and 45 will have candidates from both major parties on the ballot in November.
Your support is critical to our mission of measuring, understanding, and predicting population change and its impact. Donate to Carolina Demography today.