On average, Wake County added 63 new residents every day between April 1, 2010, and July 1, 2014, according to U.S. Census Bureau population estimates. Both natural increase, more births than deaths, and net migration, more people moving in than moving out, are important for Wake’s population growth, but the main driver is net migration. Every year since 1970, net migration into Wake County has accounted for the majority of its population growth. Since 2010, two-thirds of Wake’s growth has come from net migration, meaning about 42 more people move into Wake County each day than move out.
Why are so many people moving to Wake County?
People move for a variety of reasons: to attend school, to find work (or relocate for their job), to retire, or for other reasons, such as a better school system, lower property taxes, or a shorter commute. Nearly every county has a unique migration profile that can be differentiated by age, race, and gender. These profiles often suggest why people are moving to an area—or leaving.
The graph below displays net migration by five-year age groups for Wake County between 1960 and 1970, 1980 and 1990, and 2000 and 2010, and highlights how the county’s current migration pattern emerged over time. This graph requires some assistance in interpretation, but one illustration should suffice. For the decade of the 2000s, the peak at around 28,000 tells us that the number of 25-29 year-old persons counted in Wake County in the 2010 census was 28,000 larger than would have been expected in 2010 if the 15-19 year-olds counted in 2000 had simply been “aged forward” ten years. This age group can grow only by the addition of individuals through migration. Thus, the 28,000 person difference between the “expected” number of 25-29 year-olds and the actual Census count captures the net migration of individuals in this age group to Wake County.
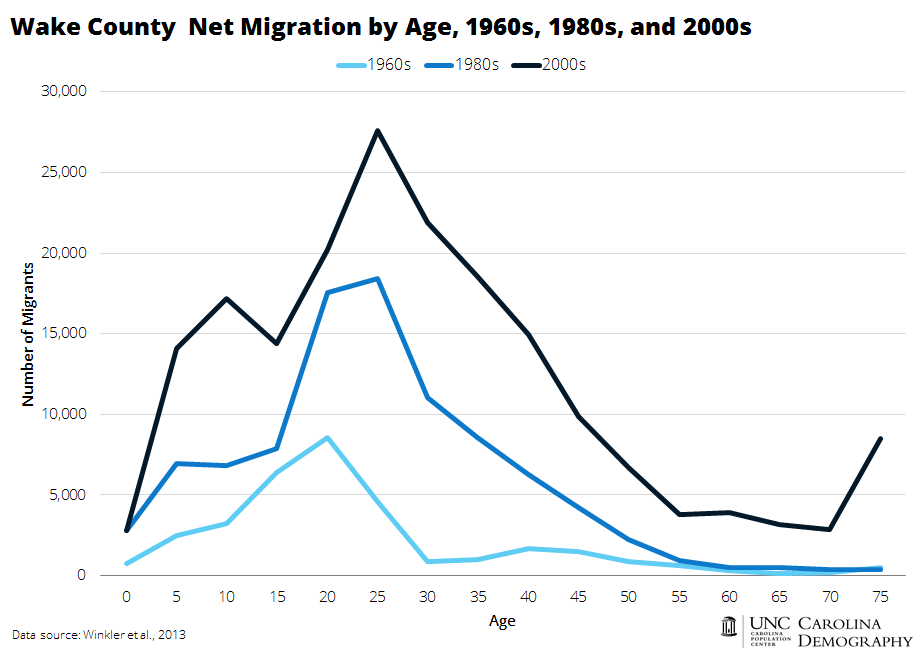
In all three time periods, net migration into Wake County is positive at all ages. In the 1960s, Wake County’s profile is closer to that of a college destination. The number of 20-24 year-olds counted in 1970 was considerably larger than would be expected based on the number of 10-14 year olds in 1960. Peak migration occurs in the late teens and then flattens out after the young adults move away.
As RTP and other industry developed, Wake County began to show signs of being an employment center. In the 1980s, net migration increased substantially among the 20-24 and 25-29 age groups, indicating its emergence as a post-college destination where individuals move for jobs. There are also hints of suburban migration, indicated by the increase in migrants between the ages of 30-44 (and their children, the migrants under the age of 15).
Wake’s rise as a major employment destination is even more evident in the 2000s, with the large spike in 25-29 year olds. The influence of colleges and universities—NC State University, Campbell University School of Law, Saint Augustine’s University, Shaw University, William Peace University, Meredith College, Wake Technical Community College and the other schools in the county—is still evident in the age-migration profile, as is the presence of suburban areas with affordable housing and access to good schools. New in the 2000s, however, is the spike in net migration among individuals age 70 and above. This may reflect the dual influence of new retirees (many of them Baby Boomers), who may be moving to be nearer children and grandchildren, as well as individuals moving to Wake for better access to health care and services.
Portions of this post originally appeared in “Wake Hits A Million: The Backstory & Future Implications.”
Your support is critical to our mission of measuring, understanding, and predicting population change and its impact. Donate to Carolina Demography today.