By on 2.8.16 in Economic Data

We love playing with data. Turning the raw numbers into meaningful insights is what we do. But the process of getting raw data into a format that is ready for analysis is often time-consuming and occasionally frustrating, even for those of us who regularly work with data. First, you have to identify the source and acquire it. Then you have to make sure you understand the general structure of the file and the variables it contains, clean it up, and format it. Using multiple indicators from different sources? Repeat this process across many sets of data. Only then are you ready to begin your analytical work.

To help you spend less time data wrangling—and more time thinking about what the numbers mean for you—we maintain a series of files of basic demographic and economic characteristics for North Carolina. All you need to access, understand, and manipulate the data is Excel or a similar spreadsheet program.

excel TS

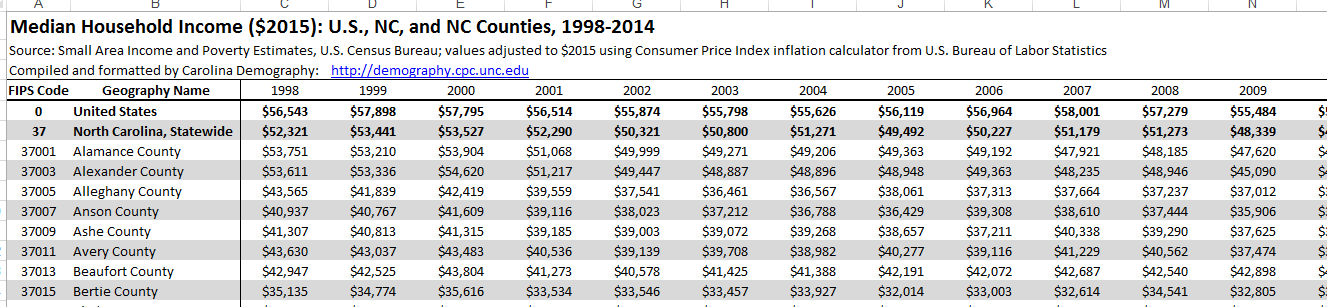
We also just released two files with up-to-date, formatted time series data for North Carolina and its counties. Here’s what you’ll find in them:

  1. NC Trends in Poverty and Income, 1998-2014 presents data from the U.S. Census Bureau’s Small Area Income and Poverty Estimates (SAIPE) program. Three indicators are available, each on a separate worksheet, with data for the United States, North Carolina, and its 100 counties for every year from 1998-2014.
    • Poverty Rate: The share of the total population that fell below the federal poverty line in a given year.
    • Child Poverty Rate: The share of the child population (ages 0-17) that fell below the federal poverty line in a given year.
    • Median Household Income: The median household income for a given year. This value is adjusted for inflation; all years present the median income in constant $2015.
  1. NC Trends in Labor Force and Unemployment, 2000-2014 presents data from the Local Area Unemployment Statistics program of the U.S. Bureau of Labor Statistics. Four indicators are available:
    • Labor Force: The total number of people (16+) who are in the civilian, noninstitutionalized labor force, regardless of whether they are working.
    • Employed Population: The total number of people (16+) who are in the labor force and are employed.
    • Unemployed Population: The total number of people (16+) who are unemployed, meaning that they did not currently have a job and had been actively looking for employment at some point in the prior 4 weeks.
    • Unemployment Rate: The unemployed population as a share of the total labor force.

Find these files helpful? Please let us know how you use them.

Need assistance with interpretation and insight? Contact us to learn more about our services.

Your support is critical to our mission of measuring, understanding, and predicting population change and its impact. Donate to Carolina Demography today.