NC in Focus: Who are NC’s unaffiliated voters?
As of October 1st, North Carolina had 5.6 million active, registered voters. Of these, 1.6 million or 29% were registered as unaffiliated.
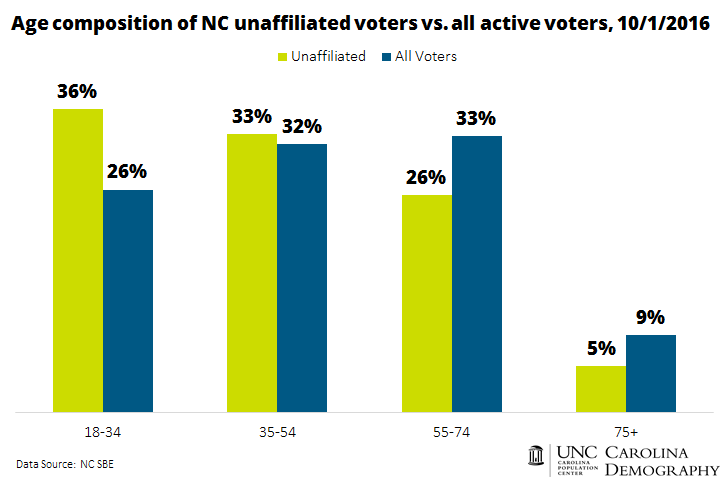
Younger voters are more likely to register as unaffiliated: 39% of voters ages 18-34 are unaffiliated compared to 30% of 35-54 year-olds, 23% of 55-74 year-olds, and 17% of voters ages 75 and older. The median age of unaffiliated voters is just 43 compared to 52 for voters registered with a party. As a result, young voters comprise a larger share of active unaffiliated voters than their share of the overall likely electorate (36% vs. 26%).
Reflecting the youth of the unaffiliated voters, these unaffiliated voters are generally newer entrants to the state’s electorate than voters who are affiliated with a major political party. Over half (52%) of unaffiliated voters first registered in North Carolina in 2010 or later compared to 33% of voters registered as Republican, Democrat, or Libertarian.
There are also significant differences in the likelihood of registering unaffiliated by race and ethnicity. Over half of Asian voters—52%—are registered unaffiliated, the highest rate of any racial/ethnic group in the state. Hispanics have the next highest rate of registering unaffiliated (41%) followed by non-Hispanic whites (31%). The two other major racial/ethnic groups in the state are much less likely to register as unaffiliated. Twenty-five percent of American Indian voters are unaffiliated and just 15% of black voters are unaffiliated.
Although Asian and Hispanic voters have the highest rates of unaffiliated registration, their relatively small number of registered voters, combined with the low proportion of black and American Indian unaffiliated voters, means the state’s unaffiliated voter pool has a higher than average share of whites. 75% of unaffiliated voters are non-Hispanic white compared to 70% of the overall electorate.
North Carolina-born voters are significantly less likely to register as unaffiliated: just 24% of NC-born voters are unaffiliated compared to 35% of voters who report another birthplace. Forty-seven percent of NC voters born in Rhode Island, New Hampshire, and Massachusetts are registered as unaffiliated. Similarly high rates of unaffiliated registration are seen among the state’s Puerto Rican-born voters (44%) and voters born in other countries (42%).
Nearly 573,000 unaffiliated voters—35% of the unaffiliated voter population—were born in North Carolina. New York (105K), other countries (84K), Virginia (62K), New Jersey (42K), and Ohio (42K) represent the next most common birth places. Thirteen percent of unaffiliated voters (218K) unaffiliated voters provided no information on place of birth.
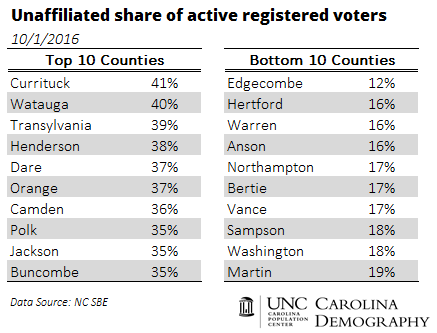
Across North Carolina’s 100 counties, the county share of unaffiliated voters varies widely, reflecting county differences in composition by age, race/ethnicity, and place of birth. Voters in coastal and western counties generally more likely to register unaffiliated while those in northeastern (non-coastal) counties were generally least likely to register as unaffiliated. Forty-one percent of active voters in Currituck County are registered unaffiliated, the highest rate in the state followed by Watauga (40%). Edgecombe County has the lowest share of unaffiliated voters: 12%.
Your support is critical to our mission of measuring, understanding, and predicting population change and its impact. Donate to Carolina Demography today.