NC in Focus: Who are NC’s Democratic voters?
As of October 1st, North Carolina had 5.6 million active, registered voters. Of these, 2.2 million or 40% were registered as a Democrat.
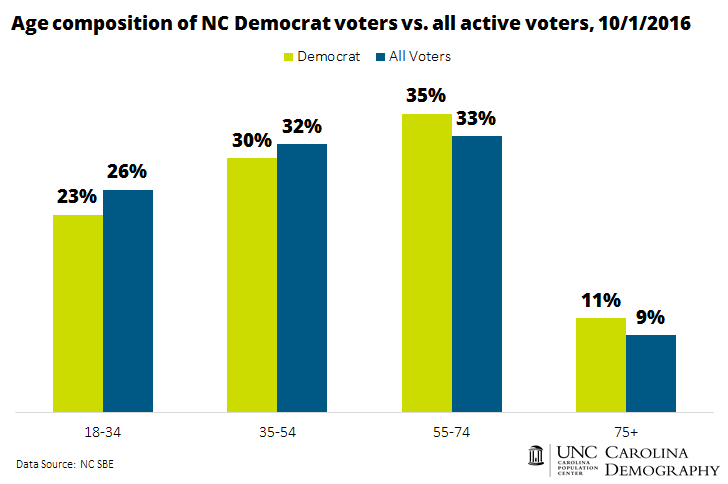
Older voters are the most likely to register as a Democrat, partly reflecting the legacy of the “Solid South.” Nearly 1 in 2 voters ages 75 and older—48%—are registered Democrats compared to 35% of 18-34 year-olds, 37% of 35-54 year-olds, and 43% of voters ages 55-74. As a result, older adults comprise a larger share of the state’s Democratic voters than the overall electorate.
Reflecting this age structure, North Carolina’s registered Democrats have the highest proportion of voters registered before 1990: 22% compared to 20% of Republicans and 7% of unaffiliated voters.
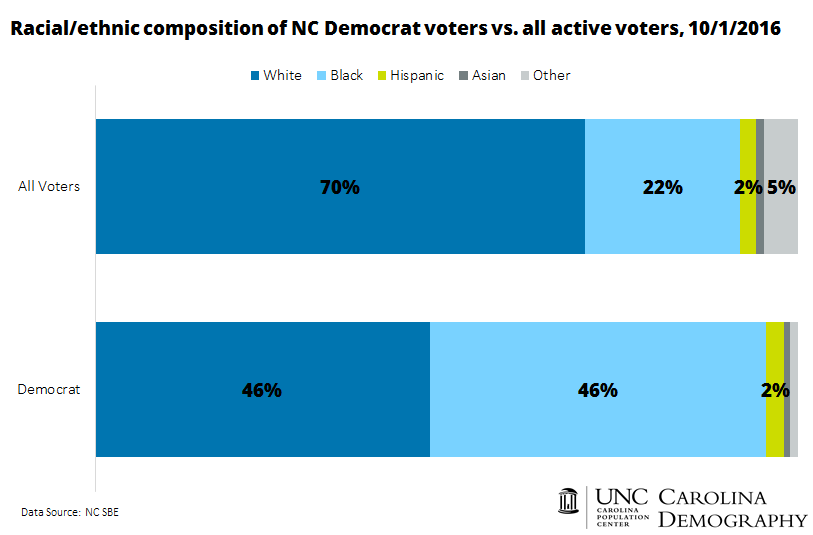
While North Carolina’s registered Republicans are overwhelmingly white, registered Democrats are much more likely to be black. Forty-six percent of Democrat voters are black compared to 22% of the electorate overall. Black voters are significantly more likely to register as a Democrat (83%) compared to other groups. Fifty-nine percent of American Indian voters, 43% of Hispanic voters, 32% of Asian voters, and 26% of white voters are registered Democrat in North Carolina.
Carolina-born voters are more likely to be registered as a Democrat: 44% of NC-born voters are registered Democrats as are 45% of NC voters born in South Carolina. North Carolina voters born in the District of Columbia are the only group more likely to be registered Democrat (51%).
Nearly 1.1 million Democrat voters—48% of the state’s Democrat voter population—were born in North Carolina. New York (121K), other countries (76K), Virginia (59K), South Carolina (57K), and Pennsylvania (45K) were the next most common birth places. Seventeen percent of Democrat voters (378K) provided no information on place of birth.
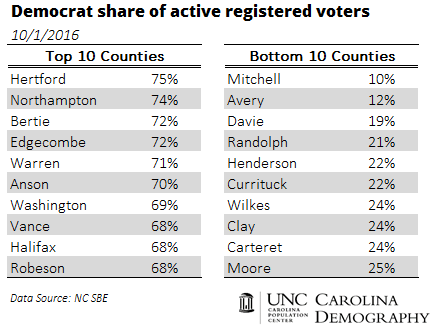
Across North Carolina’s 100 counties, the county share of Democrat voters varies widely, reflecting county differences in composition by age, race/ethnicity, and place of birth. Reflecting the inverse of registration patterns for Republican voters, northeastern counties are most likely to register Democrat while many western counties are least likely to register Democrat. Two coastal Carolina counties—Currituck and Carteret—as well as Moore County, a popular retirement destination in the Piedmont region, also have low shares of Democrat voters.
In ten counties, more than 2 of every 3 registered voters is registered as a Democrat. Seventy-five percent of registered voters in Hertford County are registered Democrat, the highest rate statewide. (Hertford also has the lowest share of Republican voters.) In contrast, Mitchell County has the lowest share of Democrat voters but the highest share of Republican voters.
Your support is critical to our mission of measuring, understanding, and predicting population change and its impact. Donate to Carolina Demography today.