Net migration has been a major driver of North Carolina’s growth since 1990 and its importance will only increase in coming years. The only other potential source of growth is natural increase—births minus deaths—and this has been declining since the recession. In my recent post, I noted that even if fertility rates increase significantly, we should not expect natural increase to rebound to prior levels, largely due to the growing impacts of population aging.
Although population aging is frequently discussed, it is often hard to fully grasp the magnitude of these impacts. One way we can try to better understand composition shifts is through standardization. To understand the impacts that the state’s changing age structure has on natural increase, I assumed a total population of 10 million (NC’s population in 2015). I then distributed this population according to the observed and projected age structure of the state in 5-year intervals from 1970 through 2035. Last, I estimated the number of deaths that would occur under a given age structure by using 2015 age-specific mortality rates from the NC State Center for Health Statistics.
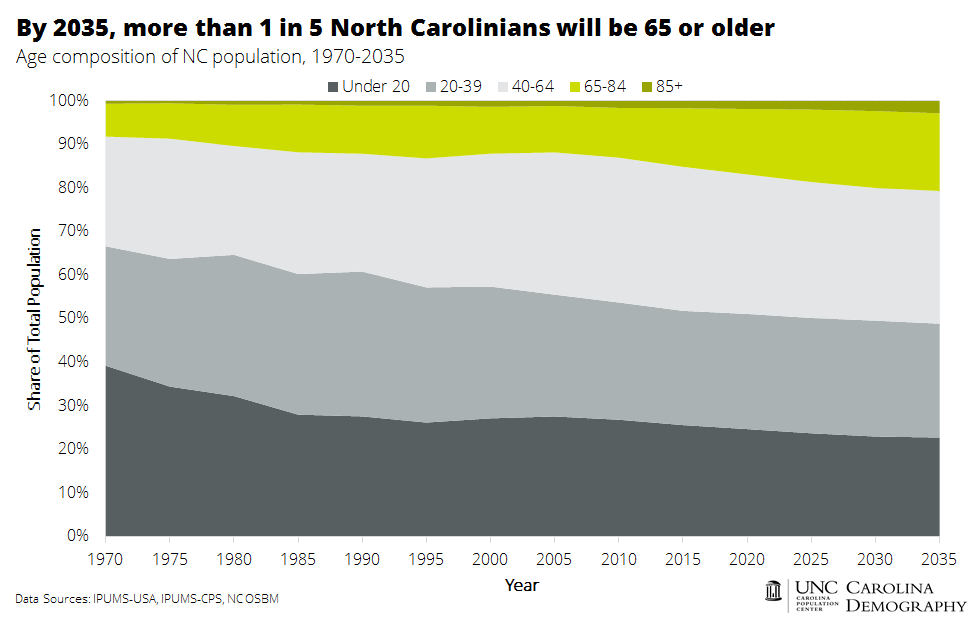
North Carolina’s age structure has shifted markedly over the past 45 years. In 1970, the impacts of the Baby Boom were still visible: 39% of the state’s population was under the age of 20. At the same time, just 8% of the population was 65 and older.
Since 1970, the population proportion under the age of 20 has steadily declined while the population at older ages has steadily grown. As of 2015, just over a quarter (26%) of the state’s population was under 20 while 15% were age 65 or older. By 2035, the under 20 population is projected to shrink to 23% of the state’s population while the 65 and older population is projected to account for 21% of all residents.
In 2015, North Carolina’s age-specific mortality rates per 100,000 ranged from 62 for individuals under age 20 to 14,482 for individuals ages 85 and older. Holding these rates constant, the estimated number of deaths shifts significantly as age structure shifts, reflecting the impact of higher mortality rates at older ages.
Applying the current rates to a population of 10 million with the state’s 2015 age structure yields just over 92,000 deaths. In comparison, the same total population and same rates with the younger age structure of 1970 would have 40% fewer deaths (54,400). A shift to the older age structure of 2035, however, would increase the number of deaths by more than 30% to 121,000.
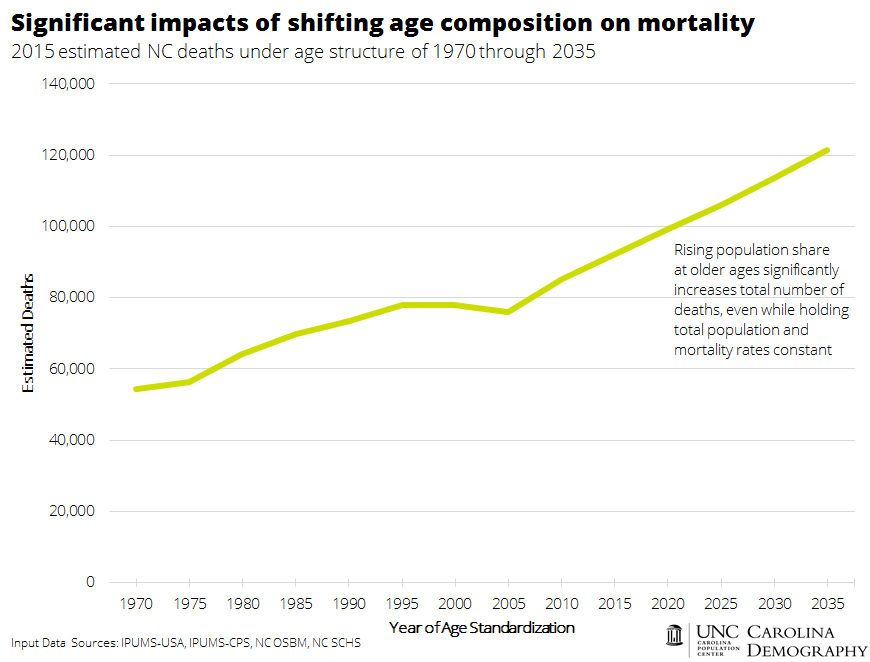
Barring radical improvements in mortality (e.g., halving older-age mortality rates – an unlikely proposition), the number of deaths in North Carolina will steadily increase as the population proportion at older ages grows. Modest increases in fertility and reductions in mortality rates are unlikely to offset the impact of this aging population on natural increase.
Your support is critical to our mission of measuring, understanding, and predicting population change and its impact. Donate to Carolina Demography today.