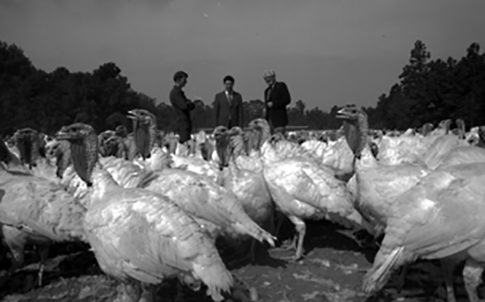
Turkey production is important to the farming sector of North Carolina. In fact, total poultry production – including turkeys, eggs and broiler chickens – is North Carolina’s top agricultural industry, making up 40% of the state’s farm income. Data from the USDA on “turkey disappearance” per capita in the United States indicated a slight uptick from about 16 pounds annually from 2012-2015 to over 16.5 pounds in 2016 and 2017 (projected). As poultry consumption increases across the country and worldwide, North Carolina is likely to benefit.
Here’s what else you should know about turkeys in North Carolina:
33.5 million
Number of birds produced by North Carolina in 2016.
1.2 billion
Number in pounds of turkey produced in 2016 – that’s 35.9 pounds of meat per bird.
2nd
North Carolina’s ranking nationally in overall turkey production, behind Minnesota.
We noted previously that North Carolina saw its peak in total production in 1993 at 62 million birds. However, higher production efficiency and technological advancement have had a major influence in decreases of total bird output, as more meat can be produced by a single bird.
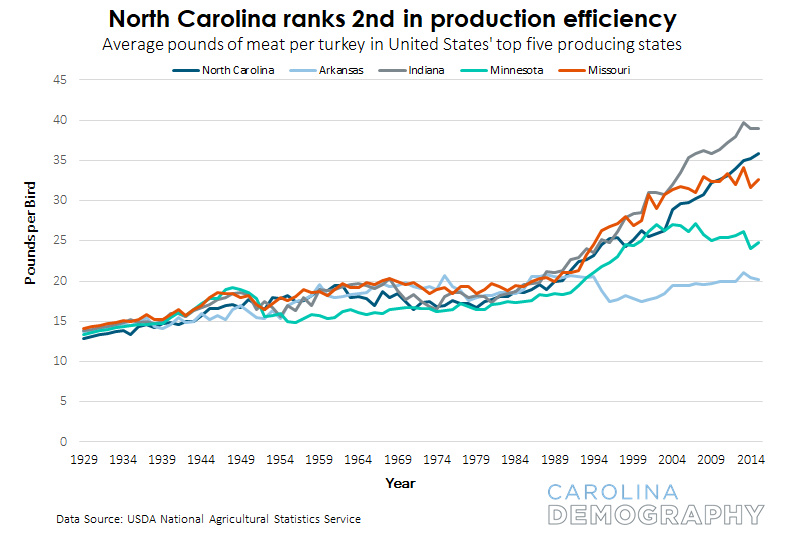
In this instance, North Carolina ranks 2nd behind Indiana in terms of efficiency, or average meat production per bird.
14%
North Carolina’s share of total turkey production, per bird, in the United States.
$993 million
This is the estimate value of North Carolina’s turkey industry in 2016. That’s an additional 224 million dollars from its valuation in 2013!
590
Number of turkey operations with sales in 2012. (Note: the USDA has updated this figure since we last reported on it in 2014.)
41%
Share of state turkey production held by Sampson and Duplin counties in 2016. Sampson produced 8.5 million turkeys (25%) last year, while Duplin produced 5.2 million (16%). This is actually a sizable decrease from 2012, when these two counties produced over half of all of North Carolina’s turkeys.
Lenoir County
This county saw the fastest growth in turkey production from 2015 to 2016 at roughly 10%.
Need help understanding population change and its impacts on your community or business? Carolina Demography offers demographic research tailored to your needs.
Contact us today for a free initial consultation.
Contact UsCategories: Economic Data
Tags: Thanksgiving, turkeys, USDA

The Center for Women’s Health Research (CWHR) at the University of North Carolina School of Medicine released the 12th edition of our North Carolina Women’s Health Report Card on May 9, 2022. This document is a progress report on the…

Dr. Krista Perreira is a health economist who studies disparities in health, education, and economic well-being. In collaboration with the Urban Institute, she recently co-led a study funded by the Kate B. Reynolds Foundation to study barriers to access to…

Our material helped the NC Local News Lab Fund better understand and then prioritize their funding to better serve existing and future grant recipients in North Carolina. The North Carolina Local News Lab Fund was established in 2017 to strengthen…
Your support is critical to our mission of measuring, understanding, and predicting population change and its impact. Donate to Carolina Demography today.