
New Geography recently reported on the extent of urban growth among the United States’ 53 major metropolitan areas (defined as having more than one million residents). Findings indicate that the majority of growth has taken place outside of the urban core, within the suburban and exurban regions of the metro area. North Carolina is home to two of these fifty-three major metropolitan areas: Charlotte and Raleigh. Using Wendell Cox’s City Sector Model, we explored the nature of urban growth particular to these two areas.
The City Sector Model “classifies population using demographic and land-use factors that changed materially around the time of World War II, after which the automobile sealed its dominance” (Cox, 2017). Urban areas that originated prior to WWII feature much greater population densities, while development taking place after 1946 has been primarily low-density suburbs. Vehicle ownership is usually necessary to live in post-war developments, as cities and towns lack adequate public transit or nearby walkable areas. Using the most recent 2012-2016 American Community Survey (ACS) data at the zip code level (ZCTA), we used the City Sector Model to classify zip codes and parse the boundaries of development in these major metropolitan areas.
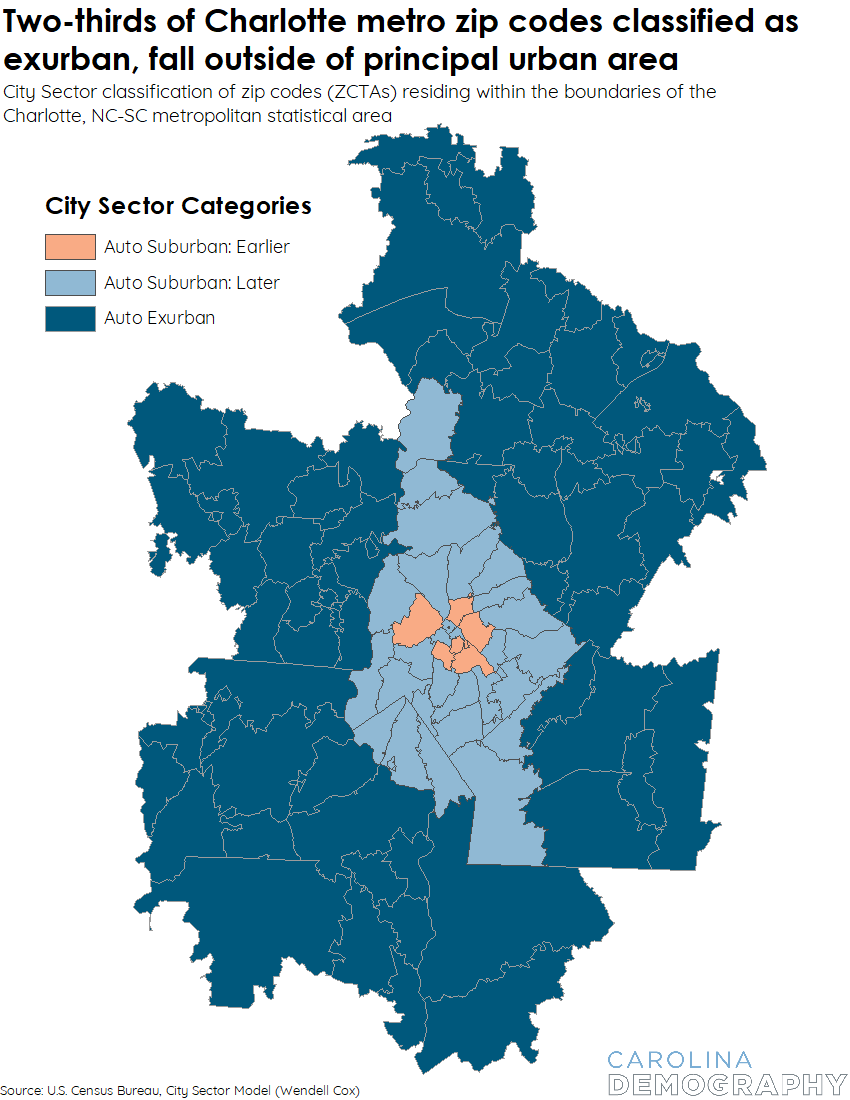
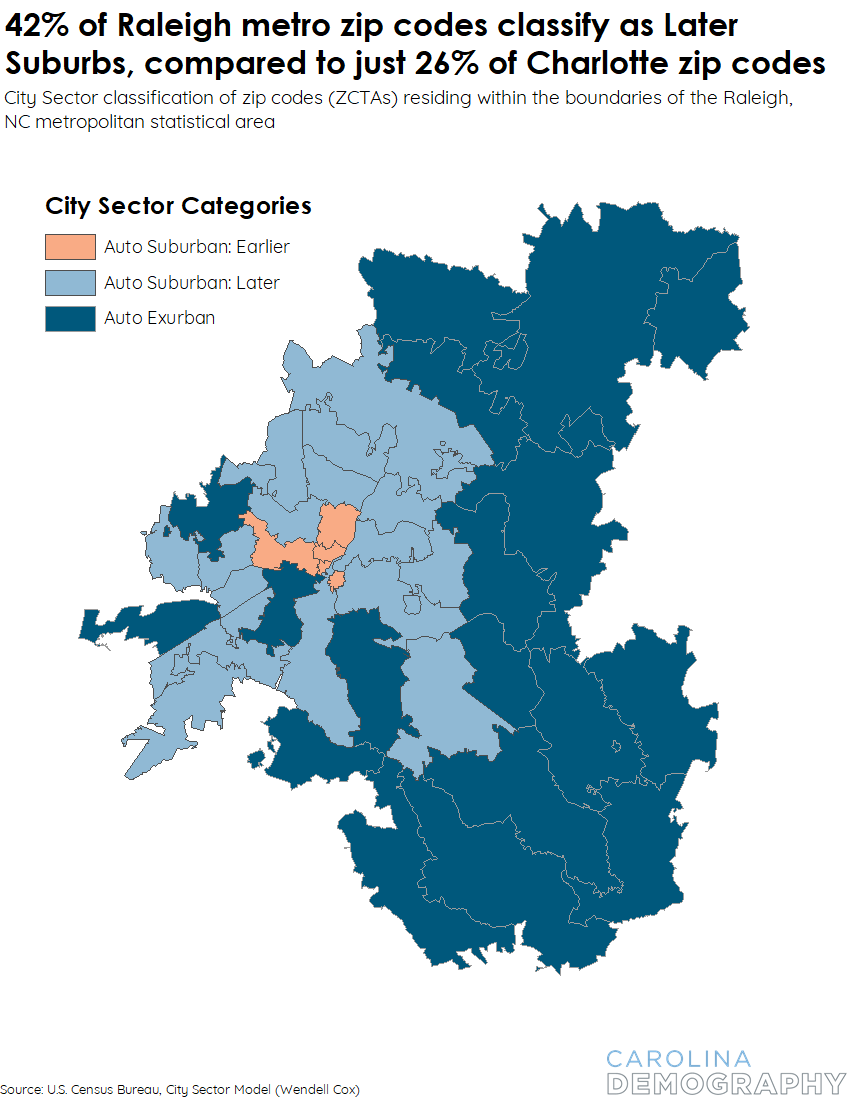
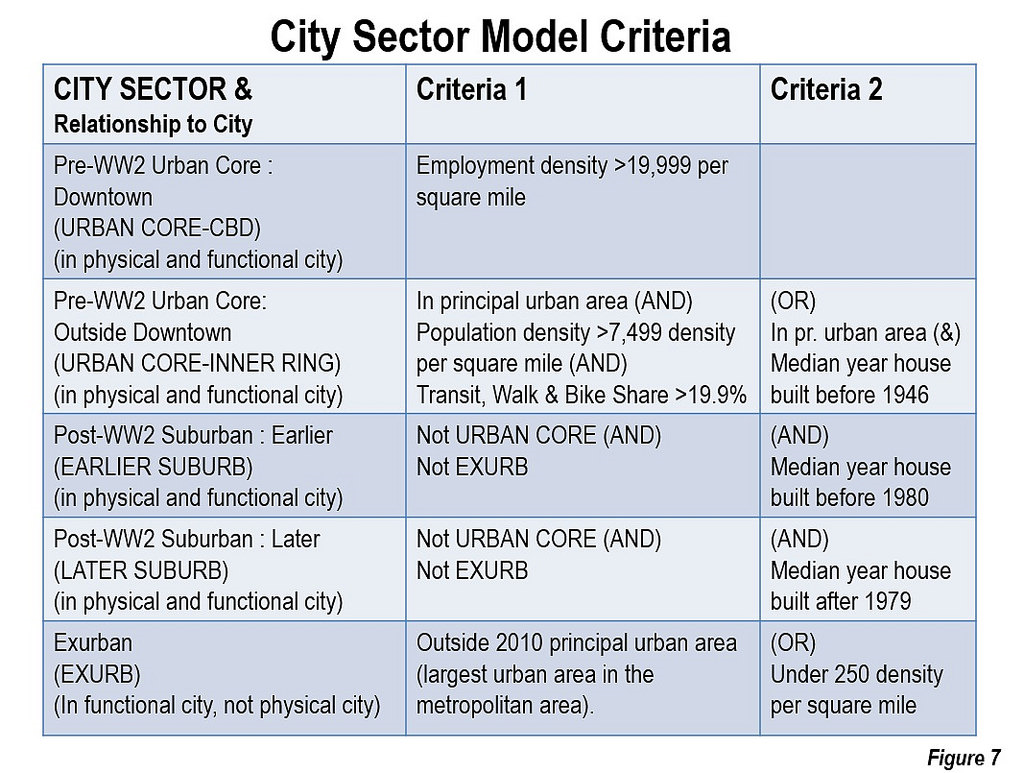
The CSM breaks down metro areas into four major development groups: Pre-WW2 Urban Core, Post-WW2 Suburban: Early (“Earlier Suburbs”), Post-WW2 Suburban: Later (“Later Suburbs”), and Exurban (“Exurbs”). Zip codes classified as Urban Core, Earlier Suburbs, and Later Suburbs must fall within the boundaries of the principal Urban Area (i.e. the physical city forming the core of the metropolitan area). Exurbs fall outside of the principal Urban Area boundaries, but within the boundaries of the greater metropolitan statistical area (MSA). In other words, these zip codes are understood to be a part of the functional city, forming a portion of its labor market and economic base. For more information on the classification criteria, please see the Appendix at the end of this blog.
Upon classification of the zip codes forming Charlotte and Raleigh’s metropolitan areas, one thing is immediately clear: there is no Pre-WWII Urban Core in either MSA. Southeastern states were largely rural up to WWII, and industrial growth occurred much later than it did in the northeastern United States. New development in the late 20th and early 21st century also replaced many existing properties, leaving behind fewer historic buildings and districts. Our analysis found no zip codes within the physical city boundaries where the median year of the local housing stock was 1946 or earlier – in fact, there are very few anywhere in the state of North Carolina.
Charlotte’s metropolitan area is primarily auto exurban – outside of the principal urban area – which may be indicative of its very recent growth into the surrounding region. The Census Bureau places the boundary of Charlotte’s principal Urban Area just over the state boundary line, as those immediate zip codes are, in form and function, a part of the physical city.
Raleigh’s metropolitan area features a greater balance of Later Suburbs to Exurbs, but despite its much longer history as a prominent city in North Carolina, it contains just as few Early Suburbs as Charlotte does. As we have noted previously, growth from these two metropolitan areas alone accounted for over 70% of North Carolina’s total growth since 2010. In the following section, we will investigate how these zip codes have developed since the 2010 Census, and if new trends are beginning to emerge.
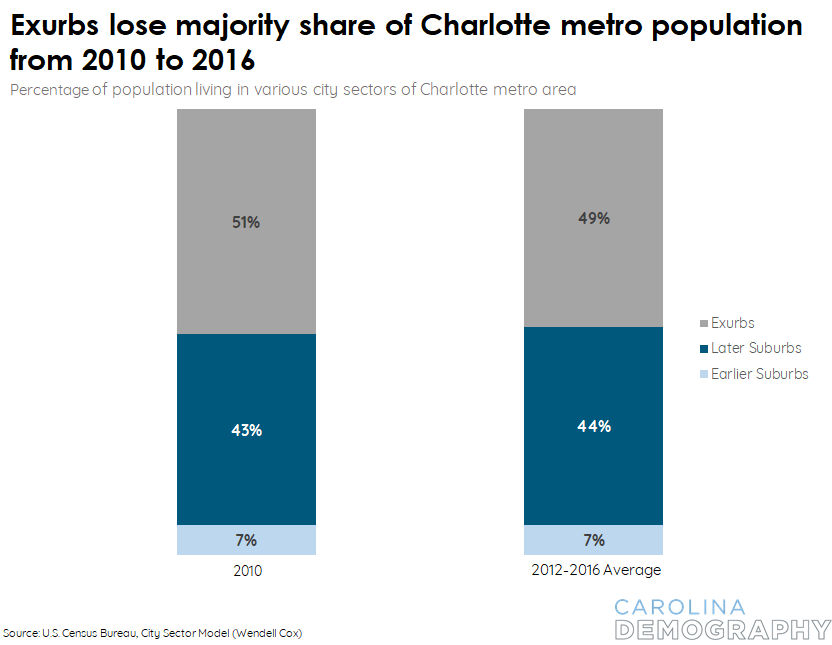
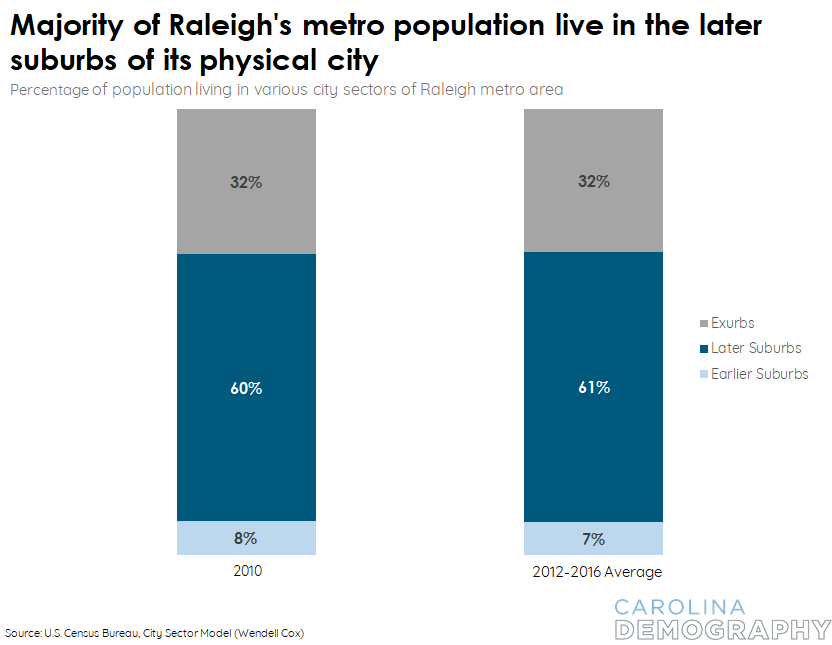
We compared the 2010 Census population data to the 2012-2016 American Community Survey data used to perform the City Sector Analysis, as New Geography did. The residential population experienced only minor changes for either MSA, yet some data suggests a potential shift in the desired city sector for new residents.
Here we sought to measure the percentage of the population living in each city sector of Charlotte and Raleigh’s metropolitan areas from 2010 and the five-year average from 2012-2016. The distribution of Charlotte’s population has remained rather unchanged from 2010, though its exurbs declined from 51% of the population in 2010 to 49%. The population share in historic neighborhoods of Charlotte remained at 7%, while the Later Suburbs gained an additional 1% share of the population during this period of time (from 43% to 44%).
Note: percentages may exceed 100% due to rounding.
Raleigh’s population composition also remained virtually identical from 2010 to 2012-16. The share of Raleigh’s population living in exurban areas experienced no change. Meanwhile, its Earlier Suburbs lost 1% of its population share, while the Later Suburbs gained 1% of the share. A much greater proportion of Raleigh’s population resides in the Later Suburbs than Charlotte’s population – 61% compared to 44%.
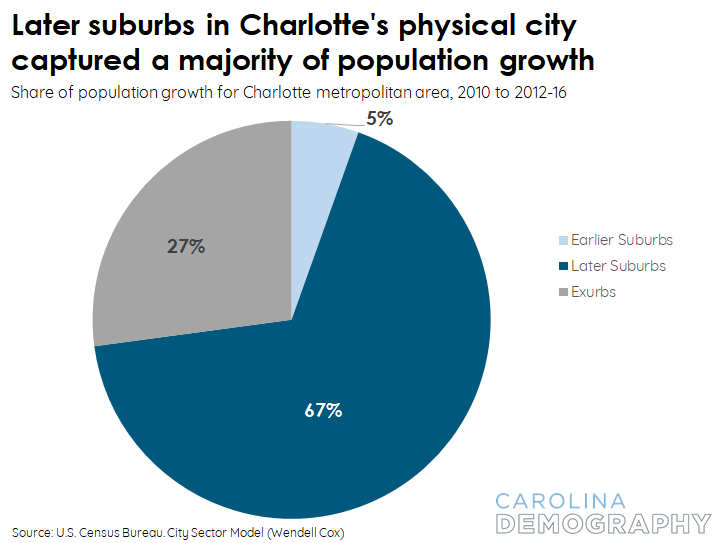
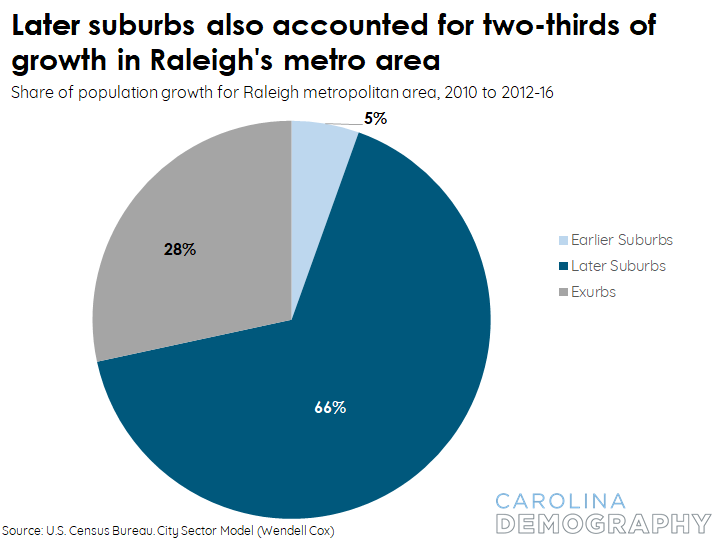
Noting this slight shift in population composition over time, we also examined where population growth occurred for Raleigh and Charlotte. They had remarkably similar profiles. The majority of population growth from 2010 to 2012-16 occurred within the Later Suburbs in both metro areas: 67% of total growth in Charlotte and 66% in Raleigh. This follows a similar pattern observed in the recent work by New Geography on all large United States’ MSAs.
While real estate markets in the twentieth century were dominated by new, low-density suburban infrastructure, shifting consumer preferences for “greater connectivity, convenient amenities…as well as a firmer commitment to sustainability”, as noted by the Research Triangle Foundation of North Carolina, have resulted in greater mixed-use, higher-density redevelopment.
While Charlotte and Raleigh lack the Pre-WWII-era “Urban Core” neighborhoods as identified by the City Sector Model – characterized by high population density and greater usage of non-auto transit – developers are designing residential areas with these pre-automobile principles in mind. One recent example of urban infill is Charlotte’s SouthPark district, currently classified as “Late Suburb”. The large share of population growth taking place in these areas, as opposed to low-density Exurban areas, may be further evidence of shifting consumer attitudes and future development.
For our analysis, we classified zip codes (ZCTAs) contained within the boundaries of the Core-Based Statistical Area (CBSA) as defined by the U.S. Census Bureau. These areas consist of “the county of counties or equivalent entities associated with at least one core (urbanized area or urban cluster) of at least 10,000 population, plus adjacent counties having a high degree of social and economic integration with the core”.
According to the model classification criteria, Urban Core, Earlier Suburban, and Later Suburban sectors must fall within the “principal urban area”. Principal Cities are also defined by the U.S. Census Bureau as “the largest incorporated place with a population of at least 10,000 in the CBSA, or if no incorporated place of at least 10,000 population is present in the CBSA, the largest incorporated place or census designated place (CDP) in the CBSA”. It also includes “any additional incorporated place or CDP with a population of at least 250,000 or in which 100,000 or more persons work; any additional incorporated place or CDP with a population of at least 50,000 and in which the number of jobs meets or exceeds the number of employed residents; and any additional incorporated place or CDP with a population of at least 10,000 but less than 50,000 and at least one-third the population size of the largest place and in which the number of jobs meets or exceeds the number of employed residents”.
One limitation to this data is that ZCTAs often extend beyond the boundaries of the CBSA and the Principal City. For the purposes of this analysis, ZCTAs with a geographic centroid (center) located within a CBSA or Principal City boundary were assigned to that area.
The Charlotte metropolitan statistical area includes seven counties in North Carolina: Mecklenburg, Rowan, Union, Iredell, Lincoln, Gaston, and Cabarrus. It also includes three counties in South Carolina: York, Lancaster, and Chester.
The Raleigh metropolitan statistical area includes three counties in North Carolina: Wake, Johnston, and Franklin.
Errata: This post originally stated that there are six counties in North Carolina associated with the Charlotte metropolitan area. There are in fact seven counties, and the post has been updated to reflect this.
Need help understanding population change and its impacts on your community or business? Carolina Demography offers demographic research tailored to your needs.
Contact us today for a free initial consultation.
Contact UsCategories: Carolina Demographics, Housing
Tags: American Community Survey, Charlotte, exurban, MSAs, municipalities, population growth, Raleigh, suburban

The Center for Women’s Health Research (CWHR) at the University of North Carolina School of Medicine released the 12th edition of our North Carolina Women’s Health Report Card on May 9, 2022. This document is a progress report on the…

Dr. Krista Perreira is a health economist who studies disparities in health, education, and economic well-being. In collaboration with the Urban Institute, she recently co-led a study funded by the Kate B. Reynolds Foundation to study barriers to access to…

Our material helped the NC Local News Lab Fund better understand and then prioritize their funding to better serve existing and future grant recipients in North Carolina. The North Carolina Local News Lab Fund was established in 2017 to strengthen…
Your support is critical to our mission of measuring, understanding, and predicting population change and its impact. Donate to Carolina Demography today.