The percentage of the state’s total population not born in North Carolina continues to rise. Recent estimates from the American Community Survey indicate that 43% of the overall population is non-native, up 1 percentage point from previous five-year estimates when this share was 42%.
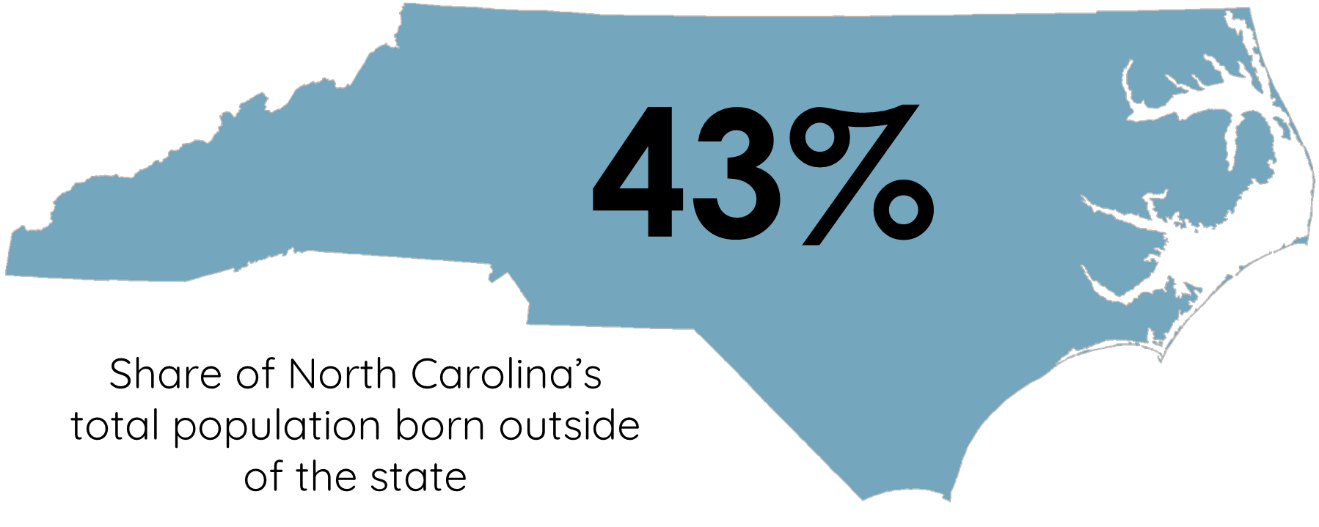
This share is even higher among the adult population. Nearly half of all individuals 18 and older were born somewhere else and this group has grown faster than the population overall. This growth reflects how attractive North Carolina is to migrants of all ages with a range of educational, employment and retirement opportunities. If these prospects remain abundant, the share of adult North Carolinians born outside of the state may continue to increase.

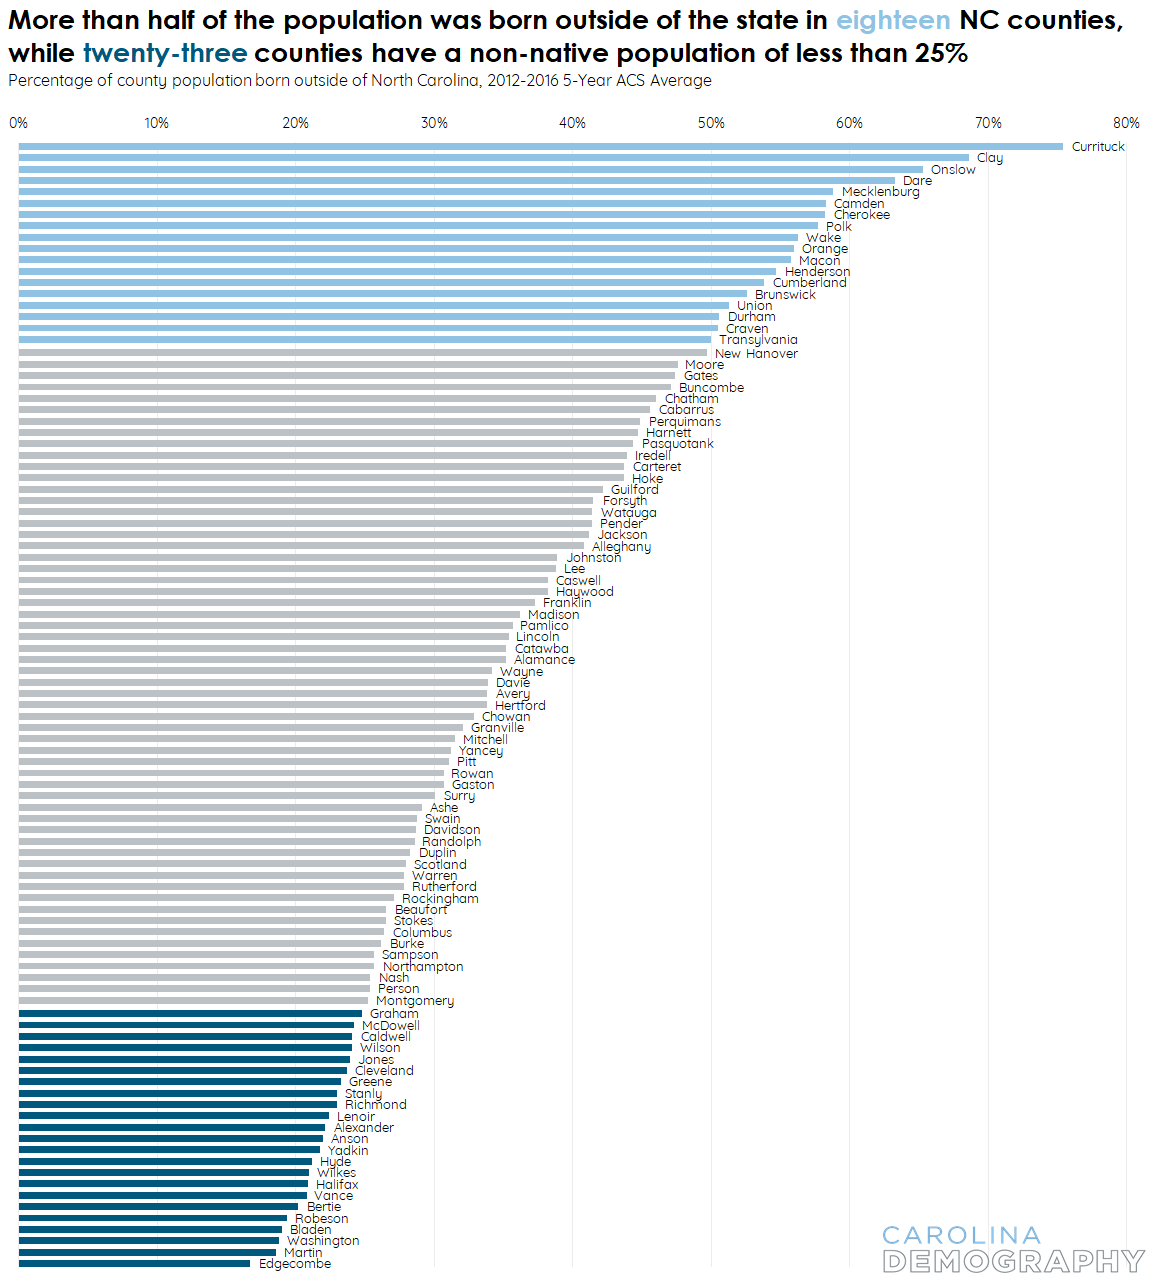
While the state share of non-native residents is 43%, the share of residents born outside of the state varies dramatically across our 100 counties. In eighteen counties, more than half of residents are non-native. Currituck County ranked number one among these counties with three-fourths of its population born outside of the state. Currituck’s close proximity and economic ties to the Virginia Beach metro area likely contributes to this large non-native population share.
Over the past five years, two new counties have seen their non-native population grow to at least half: Union County (51%) and Brunswick County (53%). These additions likely reflect the expansion of the Charlotte metro area into Union and the appeal of Brunswick County for many out-of-state retirees.
Meanwhile, Gates County—at 50% in the previous five-year period—saw its non-native population decline by three percentage points, bringing it to 47%.
At the other end, there were 23 North Carolina counties where less than one-fourth of residents were born outside of the state. Though the total number of counties has not changed, the list of counties has changed considerably in the past five years.
Four counties had non-native populations greater than or equal to 25% during 2007-2011 but not in 2012-16*:
Hyde County and Graham County saw the most significant losses at 10 percentage points and 5 percentage points, respectively.
There are also four counties whose share of non-native North Carolinians grew to one-fourth or more of the total population over this time period*:
Of these four counties, Mitchell had the largest gain in non-native population, with the share of non-native residents increasing by eight percentage points in five years.
*Note: Since its initial publishing, this text has been expanded with additional data for clarification.
Need help understanding population change and its impacts on your community or business? Carolina Demography offers demographic research tailored to your needs.
Contact us today for a free initial consultation.
Contact UsCategories: Carolina Demographics
Tags: American Community Survey, counties, immigration, migration, place of birth, population change, U.S. Census Bureau

The Center for Women’s Health Research (CWHR) at the University of North Carolina School of Medicine released the 12th edition of our North Carolina Women’s Health Report Card on May 9, 2022. This document is a progress report on the…

Dr. Krista Perreira is a health economist who studies disparities in health, education, and economic well-being. In collaboration with the Urban Institute, she recently co-led a study funded by the Kate B. Reynolds Foundation to study barriers to access to…

Our material helped the NC Local News Lab Fund better understand and then prioritize their funding to better serve existing and future grant recipients in North Carolina. The North Carolina Local News Lab Fund was established in 2017 to strengthen…
Your support is critical to our mission of measuring, understanding, and predicting population change and its impact. Donate to Carolina Demography today.