
Just over 666,000 veterans lived in North Carolina in 2016 according to the most recent American Community Survey estimates. This is a decrease of roughly 15,000 veterans or -2.2% from 2013, the year we last profiled North Carolina’s veterans. Nationally, the veteran population decreased at an even faster rate over this time (-5.6%). The U.S. veteran population declined from 19.6 million in 2013 to 18.5 million in 2016, a loss of 1.1 million veterans.
While the veteran population has been steadily declining, the total adult population continues to grow. As a result, veterans comprise a smaller share of the civilian adult population. In North Carolina, veterans now make up 8.6% of the adult population, down from 9.1% in 2013. Nationally, veterans are an even smaller share of the adult population: 7.4% in 2016 versus 8.1% in 2013.
North Carolina’s veterans are much older, on average, then the non-veteran adult population. Forty-five percent (45%) of NC veterans are 65 or older compared to just 18% of non-veteran adults. Just 10% of the state’s veterans are between the ages of 18 and 34, less than one-third the share of non-veterans (31%) in this age group.
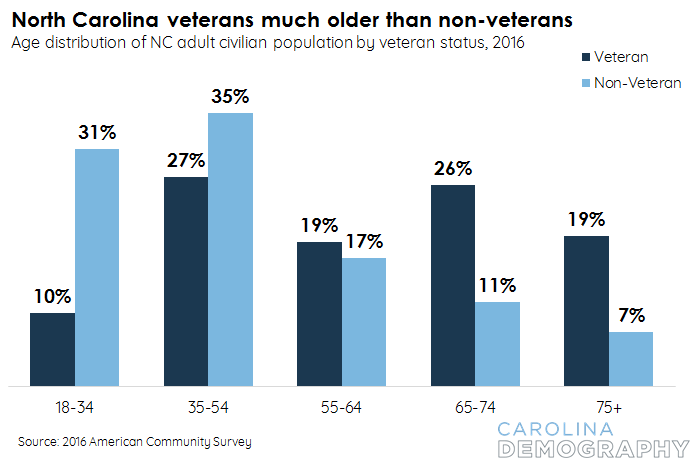
Reflecting this older age structure, North Carolina veterans are more likely to have a disability than non-veterans. Twenty-nine percent (29%) of the state’s veterans reported a disability in 2016 compared to 16% of the state’s non-veterans.
Though North Carolina’s veterans are predominantly male, the female population of veterans is growing. In 2016, one in every ten veterans (10%) in the state was female, higher than the national average of 8.6%. The population of female veterans increased from just over 63,000 individuals in 2013 to nearly 68,000 in 2016.
The veteran population is somewhat less diverse than the state’s overall adult population, reflecting the relatively older age structure. Among North Carolina’s veterans:
The share of veteran adults identifying as Hispanic or Latino is less than half of the non-veteran share: 3.5% vs. 7.6%.
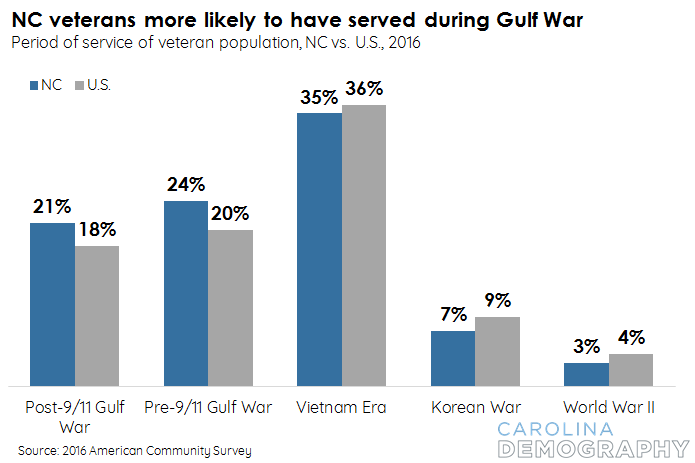
In North Carolina, like the nation, the largest share of veterans served during the Vietnam era: 35% in NC and 36% nationwide. Compared to the national average, North Carolina’s veterans are more likely to report Gulf War era service (45% vs. 38% nationally) and less likely to have served during the Korean War or World War II (10% vs. 13%).
Compared to their non-veteran peers, North Carolina veterans of prime working age (18-64) are slightly more likely to be in the labor force and less likely to be unemployed:
North Carolina’s veterans also had much higher median incomes than the non-veteran population. Among the population receiving income, the median veteran income in 2016 was $37,341, more than $11,000 higher than the median non-veteran income of $26,002.
Reflecting these higher incomes, North Carolina’s veterans were much less likely to be in poverty than non-veterans. Just 7.1% of the state’s veteran population had incomes below the poverty line in 2016, half the rate of the state’s non-veteran adult population (14.2%).
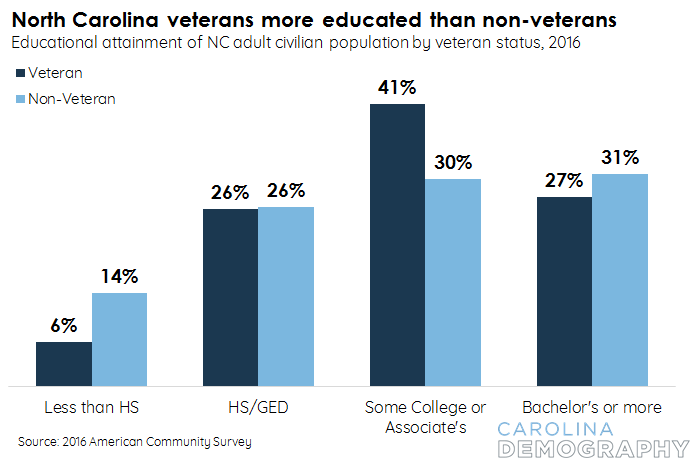
Though non-veterans are slightly more likely to hold a bachelor’s degree or higher (31% vs. 27% of veterans), North Carolina’s veterans are much more likely to have attended some college or received an associate’s degree (41% vs. 30%). In total, 68% of North Carolina veterans have some college or a postsecondary degree compared to 62% of non-veterans.
Veterans are also much more likely than non-veterans to have completed high school: just 6% of NC veterans reported less than a high school diploma in 2016 versus 14% of non-veterans.
Need help understanding population change and its impacts on your community or business? Carolina Demography offers demographic research tailored to your needs.
Contact us today for a free initial consultation.
Contact UsCategories: Carolina Demographics
Tags: age, American Community Survey, education, ethnicity, income, poverty, race, sex, veterans

The Center for Women’s Health Research (CWHR) at the University of North Carolina School of Medicine released the 12th edition of our North Carolina Women’s Health Report Card on May 9, 2022. This document is a progress report on the…

Dr. Krista Perreira is a health economist who studies disparities in health, education, and economic well-being. In collaboration with the Urban Institute, she recently co-led a study funded by the Kate B. Reynolds Foundation to study barriers to access to…

Our material helped the NC Local News Lab Fund better understand and then prioritize their funding to better serve existing and future grant recipients in North Carolina. The North Carolina Local News Lab Fund was established in 2017 to strengthen…
Your support is critical to our mission of measuring, understanding, and predicting population change and its impact. Donate to Carolina Demography today.