
North Carolina’s Hispanic or Latino population increased by nearly 116,000 resident between 2012 and 2017, an increase of 13.8% in just five years. The adult population grew faster than the child population over this period. And for both Latino adults and children, growth was due entirely to an increase in the citizen population. The non-citizen population of Latino children and adults decreased by 23.1% and 10.4%, respectively, between 2012 and 2017.
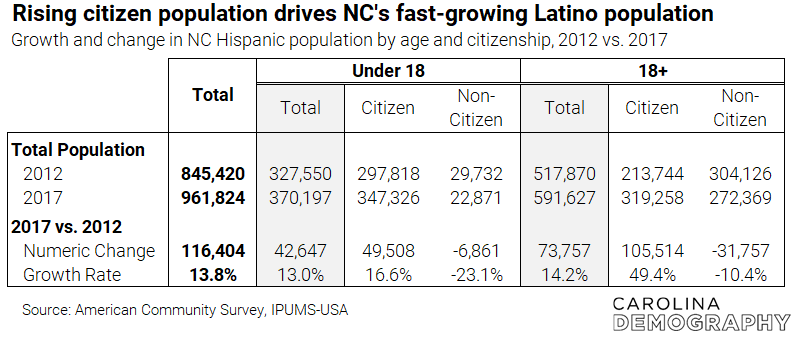
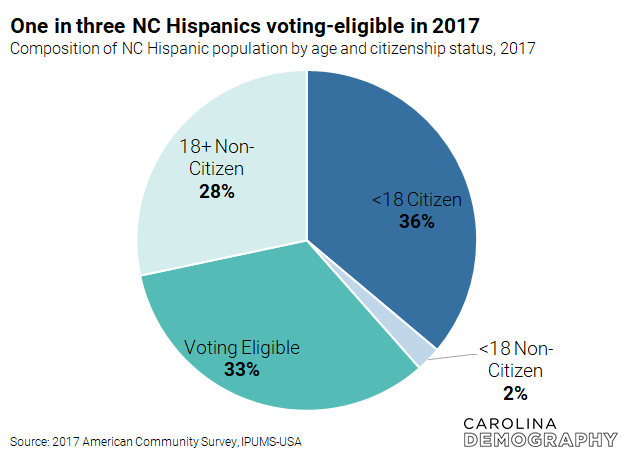
As a result of these changes, the voting eligible population—individuals who are both 18 or older and a citizen (native-born or naturalized)—is the fastest-growing segment of the state’s Hispanic population. This population increased by 105,514 or 49.4% over five years, more than twice the growth of the voting-eligible Latino population nationwide (22.1%). In 2012, just one in four NC Hispanic residents was voting eligible. As of 2017, this shared had increased to one in three.
The graph below shows the North Carolina Hispanic population by age and citizenship status based on data from the 2017 American Community Survey. The teal bars represent Hispanic individuals currently of voting age (18+): the dark shading represents citizens (voting eligible) while the light teal represents non-citizens. The blue bars represent North Carolina Hispanic or Latino children who are under 18. Similarly, the dark blue represents citizens (future voting eligible) and the light blue represents non-citizens.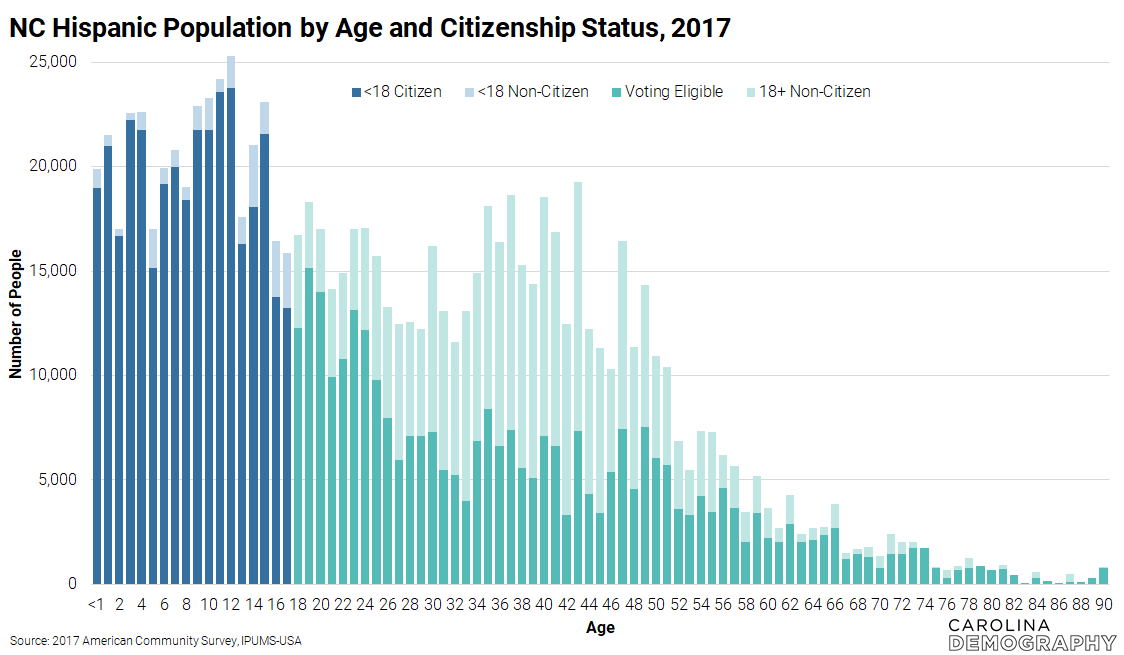
In our post from 2014, we predicted that the size of the voting eligible Hispanic population would likely surpass 300,000 by 2020. According to the most recent ACS data, this has already occurred.
As of 2017, more than 319,000 of North Carolina’s 592,000 Hispanics age 18 and older were eligible to vote. This represents more than half of the state’s Latino adults (54%). An even greater percentage—88%—of the Hispanic residents who will turn 18 between 2017 and 2020 are citizens. These individuals will increase the size of the voting eligible Hispanic population by another 50,000 in 2020.
These trends are not isolated to North Carolina, but they are more pronounced in the state due to the relatively recent impact of Hispanic immigrants. Compared to other states, North Carolina had the 16th largest population of voting-eligible Latinos in 2017. In contrast, North Carolina had the:
Voting-eligible Hispanics represent a contested piece of the electorate, though they have historically been less likely to register and vote. In future posts, we plan to explore:
Please let us know if you have other questions that we can address in future blog posts by writing demography@unc.edu.
Need help understanding population change and its impacts on your community or business? Carolina Demography offers demographic research tailored to your needs.
Contact us today for a free initial consultation.
Contact UsCategories: Elections & Voting
Tags: citizenship, electorate, Hispanic, voting

The Center for Women’s Health Research (CWHR) at the University of North Carolina School of Medicine released the 12th edition of our North Carolina Women’s Health Report Card on May 9, 2022. This document is a progress report on the…

Dr. Krista Perreira is a health economist who studies disparities in health, education, and economic well-being. In collaboration with the Urban Institute, she recently co-led a study funded by the Kate B. Reynolds Foundation to study barriers to access to…

Our material helped the NC Local News Lab Fund better understand and then prioritize their funding to better serve existing and future grant recipients in North Carolina. The North Carolina Local News Lab Fund was established in 2017 to strengthen…
Your support is critical to our mission of measuring, understanding, and predicting population change and its impact. Donate to Carolina Demography today.