It’s been almost three years since the 2016 general election and in that time, there have been demographic shifts in North Carolina. With just under a year before the 2020 election cycle, we’ve broken down the changes by partisan composition and who makes up our newly registered voting population.
First, we should note: our state’s population continues to grow
North Carolina has experienced steady population gains since 2016, with net gains masking a larger turnover in the underlying population. For example, North Carolina added more than 85,000 new residents from net migration in 2017, with nearly 370,000 individuals moving here from another state or country and roughly 285,000 North Carolinians moving out.
A concrete way to understand the potential impact of demographic change on North Carolina’s electorate is to look at new voting registrations since the general election. This number includes new residents in the state, individuals who became 18+ or gained citizenship since 2016, and prior residents who are registering to vote for the first time. According to the NC State Board of Elections, there have been 1.1 million voter registration forms filed since the November 8, 2016 general election.
What is the partisan composition of NC’s new voters?
New voter registrations suggest an overall swing away from major parties and towards unaffiliated, with the greatest impact on the Democrat share of registrations. Among new registrants since the 2016 general election:
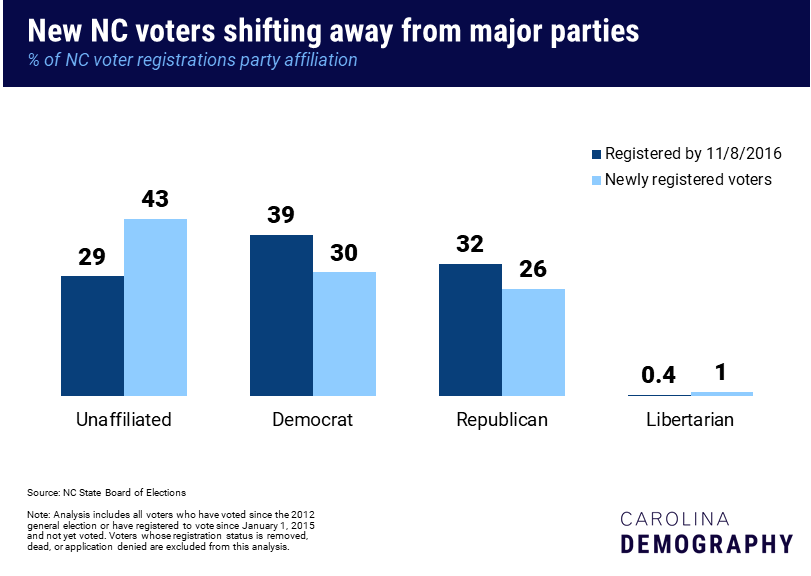
As my colleague Michael Bitzer at Catawba College can show you, unaffiliated or independent voters are rarely truly unaffiliated. These voters tend to lean one way or the other and generally vote with the party of their preference. What these patterns do mean is that it is currently more challenging to predict party affiliation from voter registration data.
What is the demographic makeup of these new voters?
Compared to voters who were registered prior to the 2016 general election, newly registered NC voters were more likely to identify as Hispanic (5% vs. 2%) or Asian (2% vs. 1%). One in three Hispanic voters is a newly registered voter (compared to one in six overall).
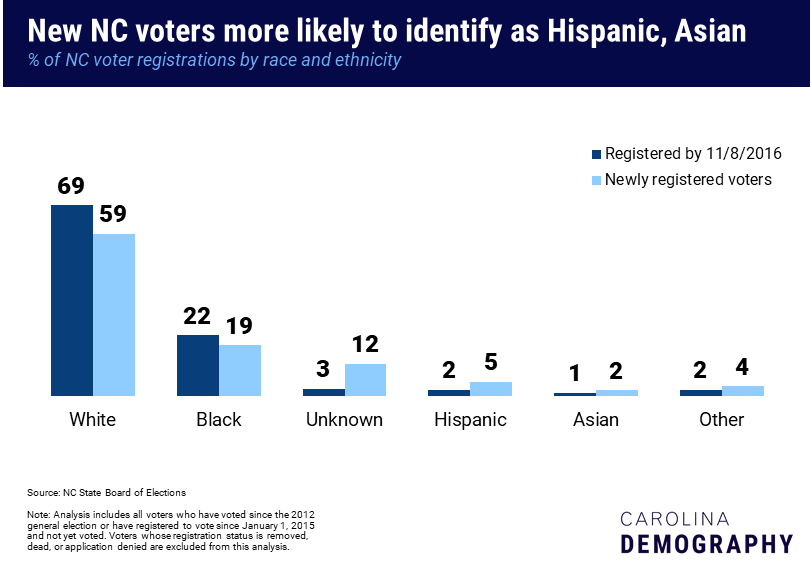
New voters were also much less likely to report their race or ethnicity on the registration form: 12% of new voters did not provide information on their race or ethnicity compared to 3% of voters registered prior to the 2016 election.
How old are our newly registered voters?
A much larger share of newly registered voters are young voters. This is partly because many of these young adults are newly eligible to vote and are registering for the first time, but also because young adults are more likely to move than older adults. Colleges and universities, military bases, and employment opportunities in our state’s metro areas attract many young adults from other states and countries. Among the 680,000 NC registered voters ages 18-24, for example, roughly half were registered prior to the 2016 election and half have registered since then.
Where were our new voters born?
New voters are less likely than voters who were registered for the 2016 election to report being North Carolina natives (33% born in state vs. 44%). Conversely, new voters were more likely to report the following birth places compared to previously registered voters:
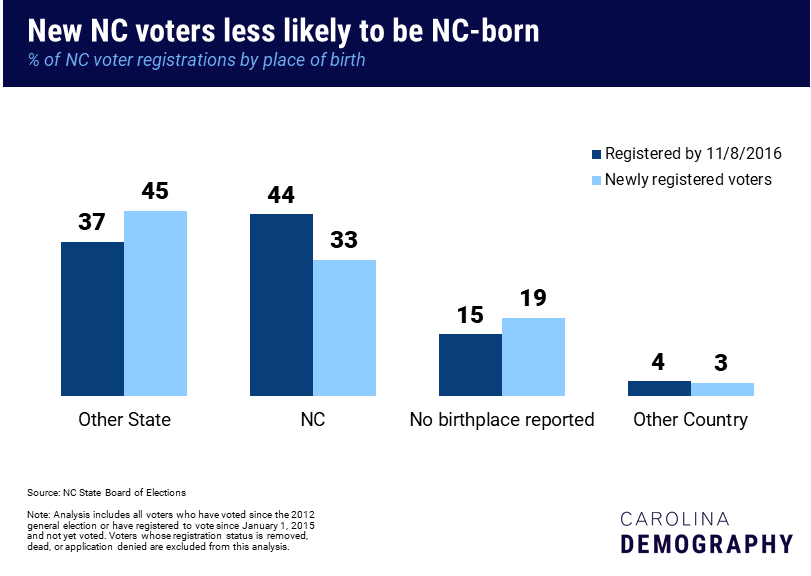
Based on current trends, North Carolina’s population is projected to continue its steady gains through 2020 and the voting population will similarly grow.
Have questions about NC’s voting population in advance of the 2020 election? Let us know. (Note: while we love to make population projections, we don’t make predictions about election outcomes.)
Note: We used the voter history file and current voter registrations (as of July 6, 2019) from the NC State Board of Elections to identify current voters. Current voters were identified as voters who have voted in any election since the 2012 general election or voters who registered on or after January 1, 2015 who have not yet voted. Voters who were reported removed, dead, or having had their registration application denied were excluded from the analysis.
Need help understanding population change and its impacts on your community or business? Carolina Demography offers demographic research tailored to your needs.
Contact us today for a free initial consultation.
Contact UsCategories: Elections & Voting, NC in Focus

The Center for Women’s Health Research (CWHR) at the University of North Carolina School of Medicine released the 12th edition of our North Carolina Women’s Health Report Card on May 9, 2022. This document is a progress report on the…

Dr. Krista Perreira is a health economist who studies disparities in health, education, and economic well-being. In collaboration with the Urban Institute, she recently co-led a study funded by the Kate B. Reynolds Foundation to study barriers to access to…

Our material helped the NC Local News Lab Fund better understand and then prioritize their funding to better serve existing and future grant recipients in North Carolina. The North Carolina Local News Lab Fund was established in 2017 to strengthen…
Your support is critical to our mission of measuring, understanding, and predicting population change and its impact. Donate to Carolina Demography today.