
Each September, local community leaders gather for a comprehensive overview of the Chapel Hill-Carrboro community. Hosted by The Chamber for a Greater Chapel Hill-Carrboro, the State of the Community Report details how Chapel Hill, Carrboro, and the surrounding area are performing on various social, environmental and economic indicators.
For the third year in a row, Carolina Demography will provide social, economic, and demographic data for The Chamber’s annual event. But simply calling us the “data provider” for the Chamber doesn’t paint a full picture of our ongoing work with them.
When The Chamber for a Greater Chapel Hill-Carrboro first approached us three years ago, they wanted to ensure that they were identifying and accessing the appropriate data sources for the metrics they needed to track over time. We worked closely with Chamber leaders to identify the appropriate data sources and integrate their internal data with data from external sources to paint a more comprehensive demographic picture of the region. We then ensured that they were displaying that information in a way that best represented the underlying data.
This databook, which we now maintain and update on an annual basis, is used by Chamber staff, as well as county, city, and town stakeholders to ensure that all community leaders in the Greater Chapel Hill area are drawing from the same pool of information when making strategic decisions about their community.
We continue to work with chambers of commerce across the state to provide demographic profiles and insights that can then help local community leaders plan and make decisions. Some of the questions we can answer:
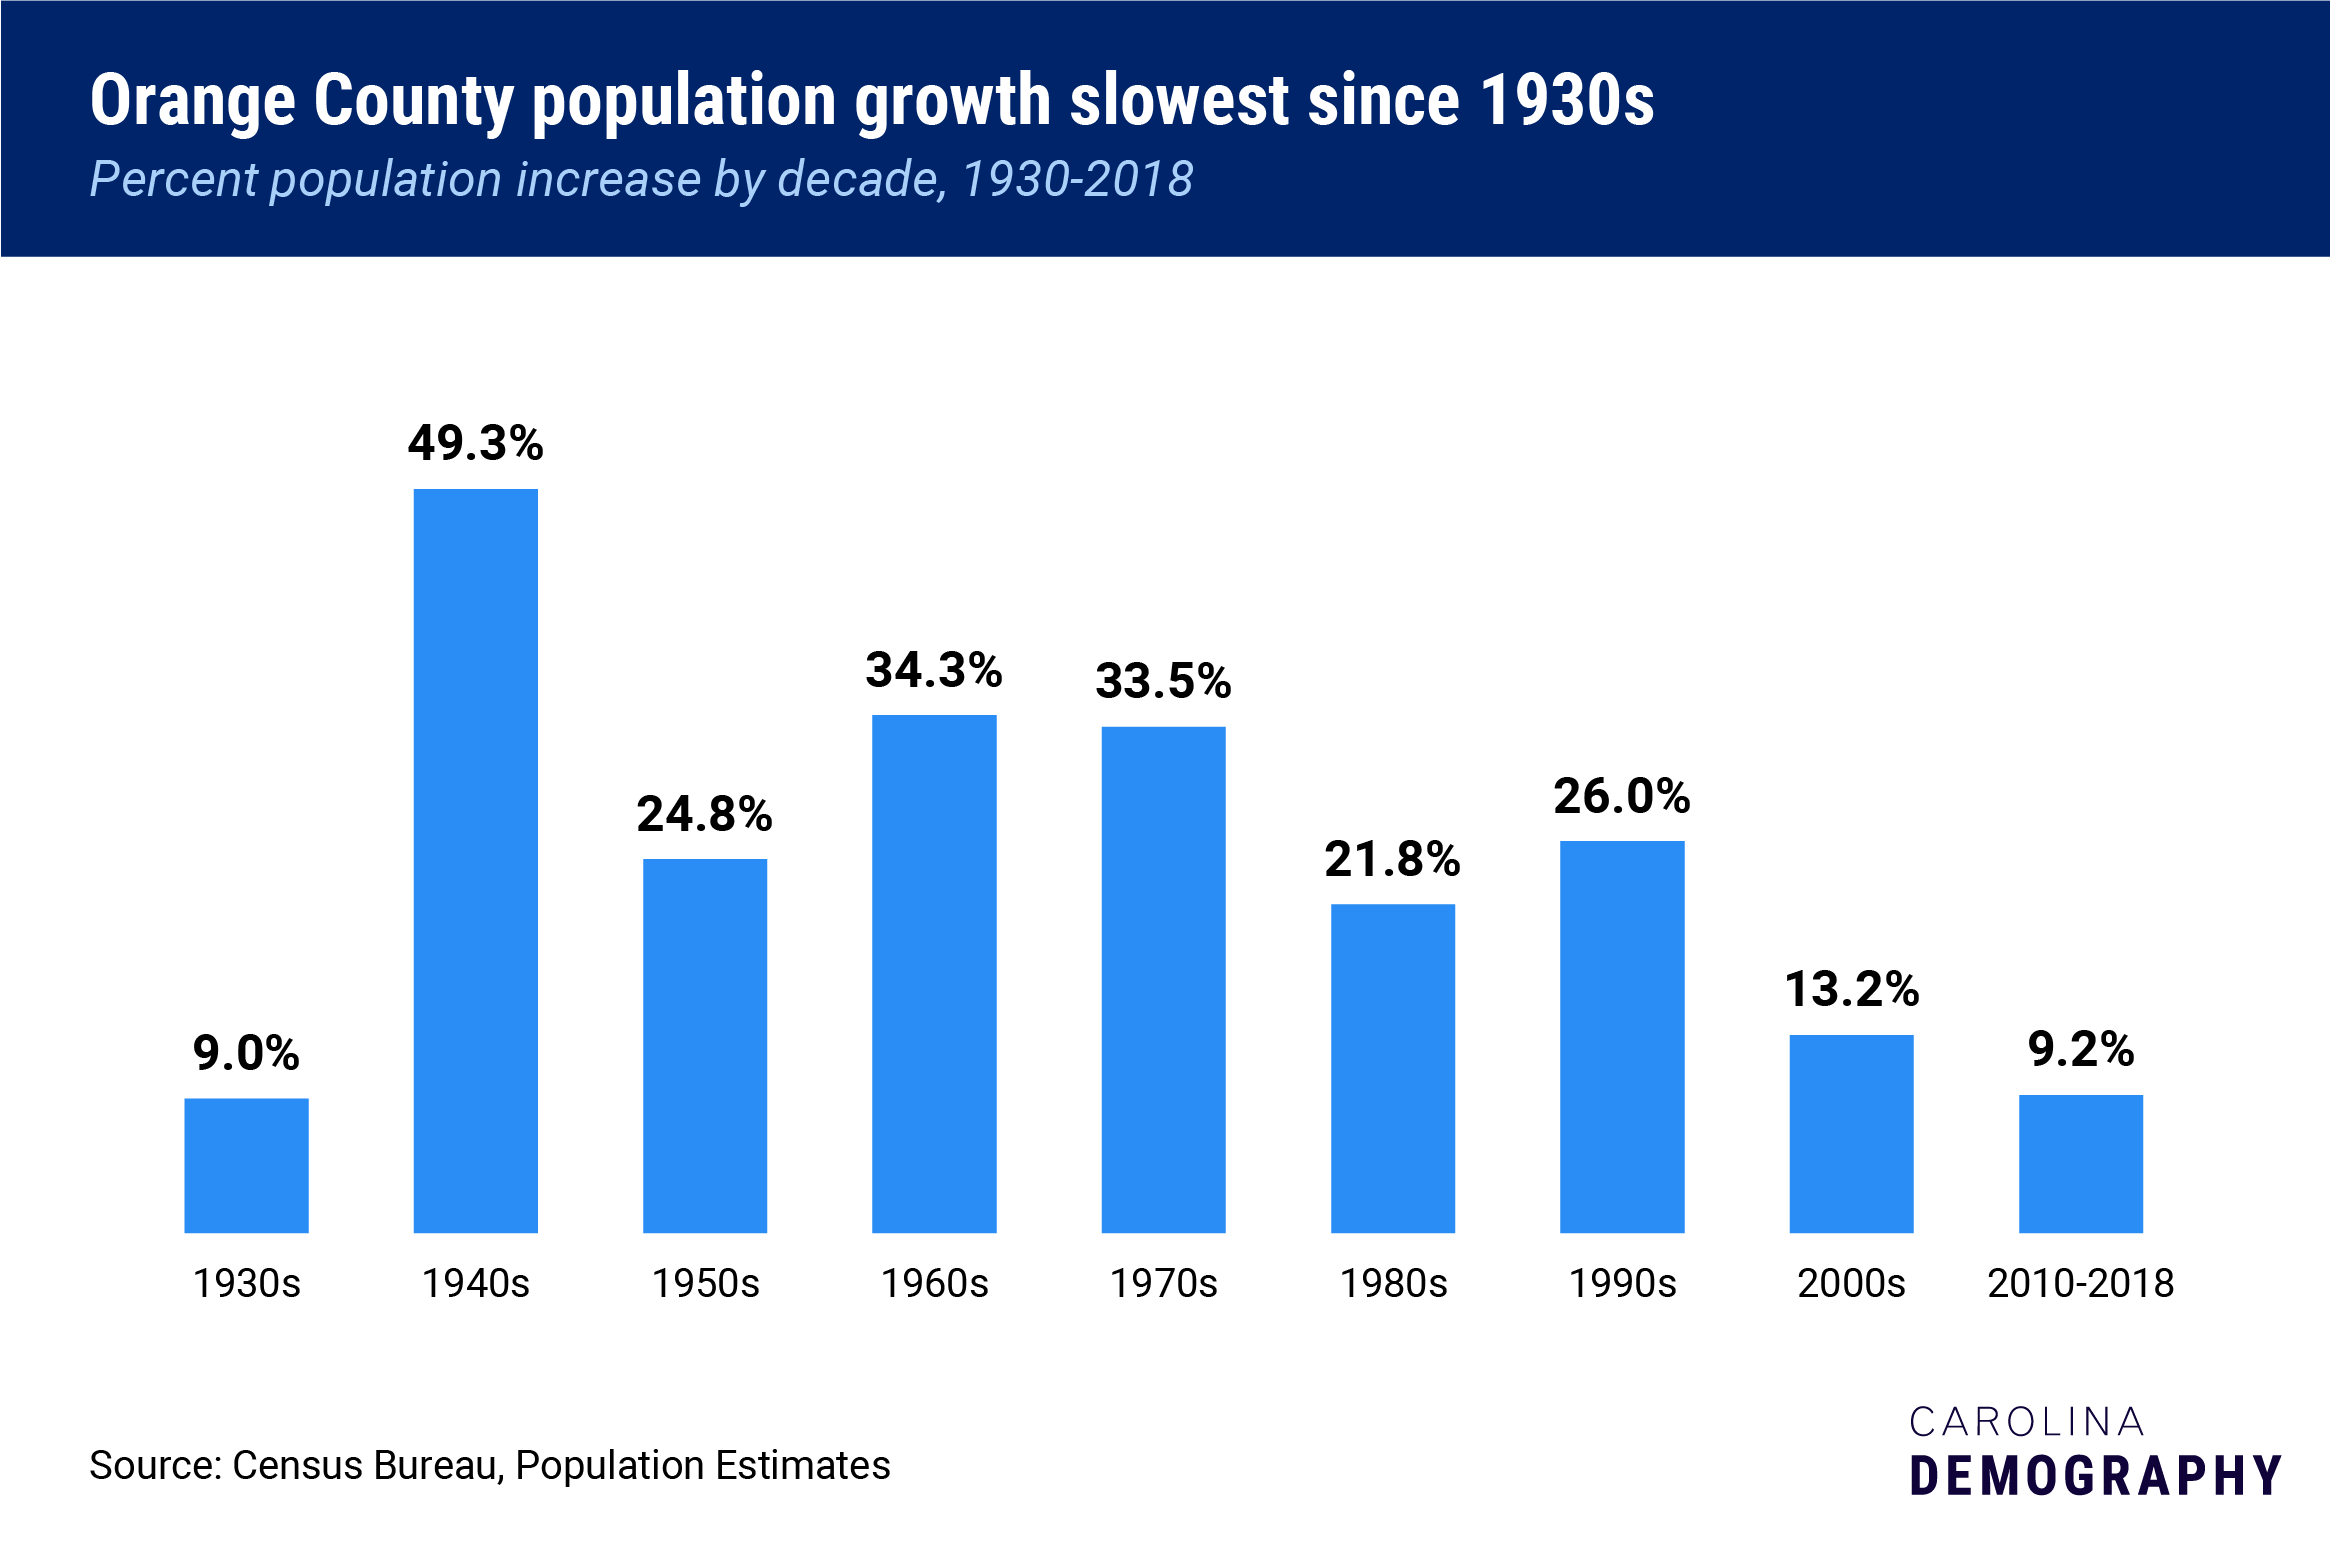
At 9.2%, Orange County’s population growth from 2010 to 2018 has been slower than any other decade since the 1930s. Current trends for this decade suggest that the growth rate will likely remain slightly below its 2000s rate (13.2%), and far below the 1990s (26%) and earlier decades. This has also marked the slowest decade of growth for the three incorporated places in Orange County – Chapel Hill, Carrboro, and Hillsborough.
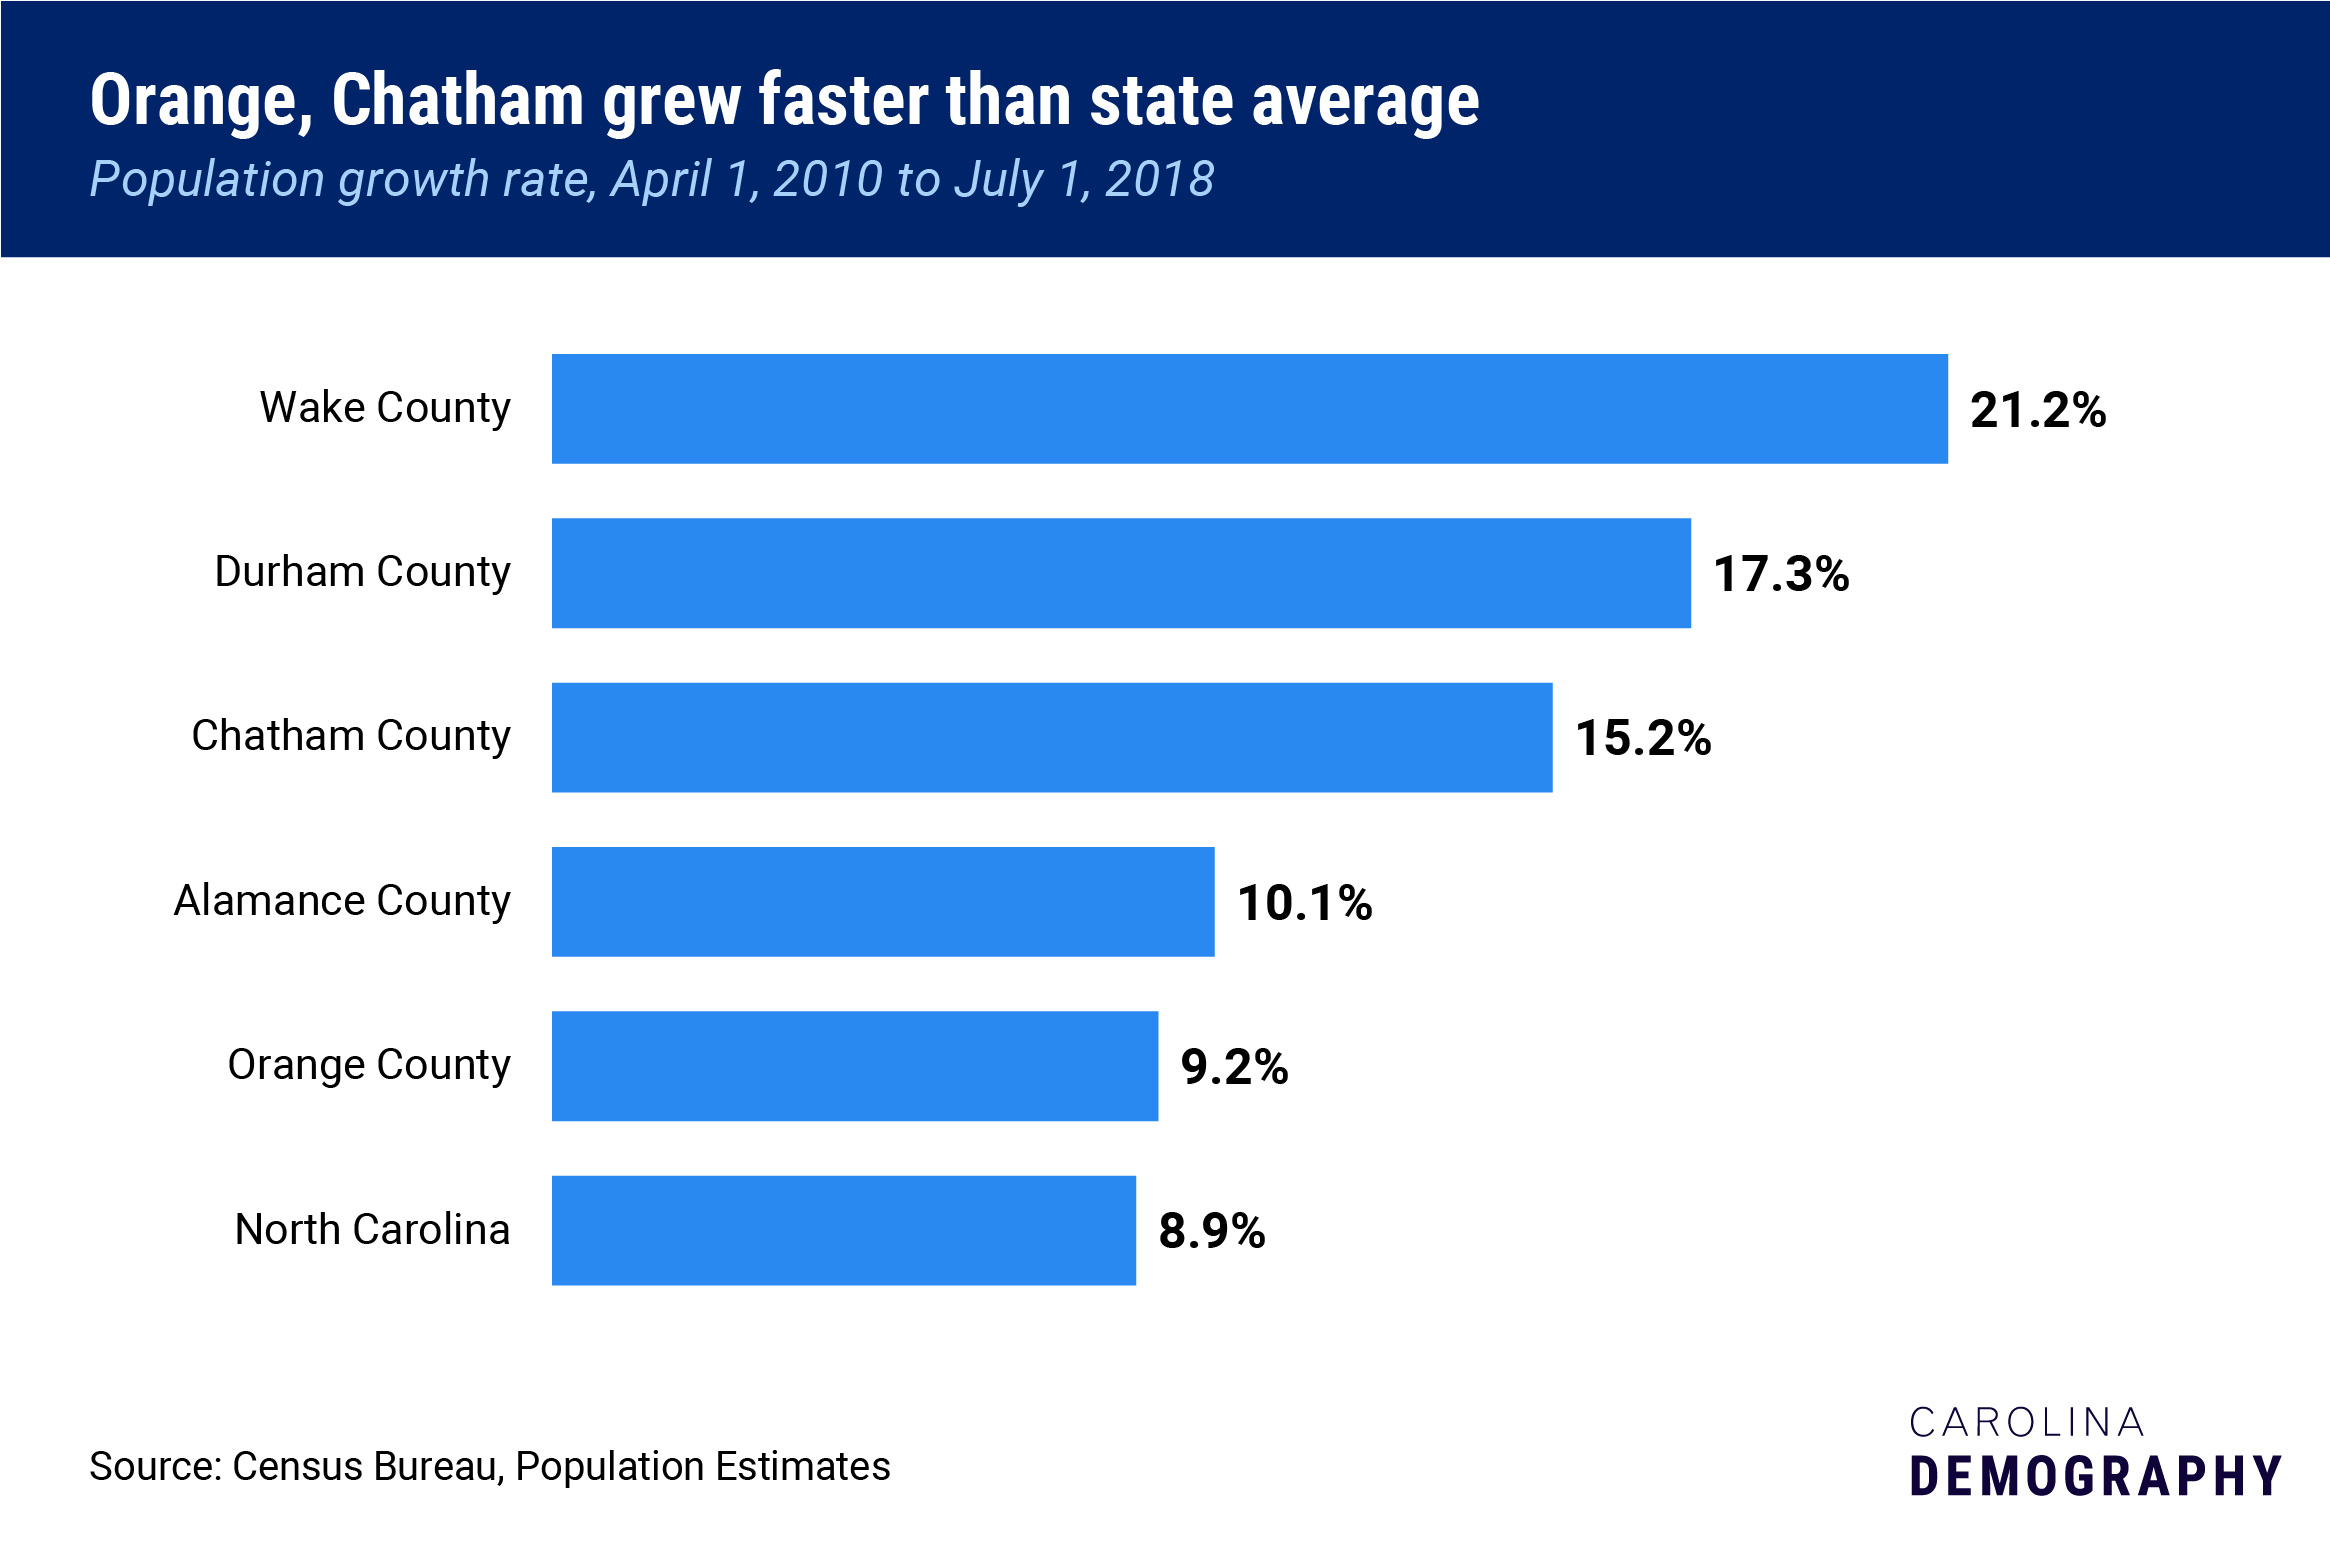
Despite this slow growth compared to prior decades, Orange County has grown slightly faster than the state since 2010.
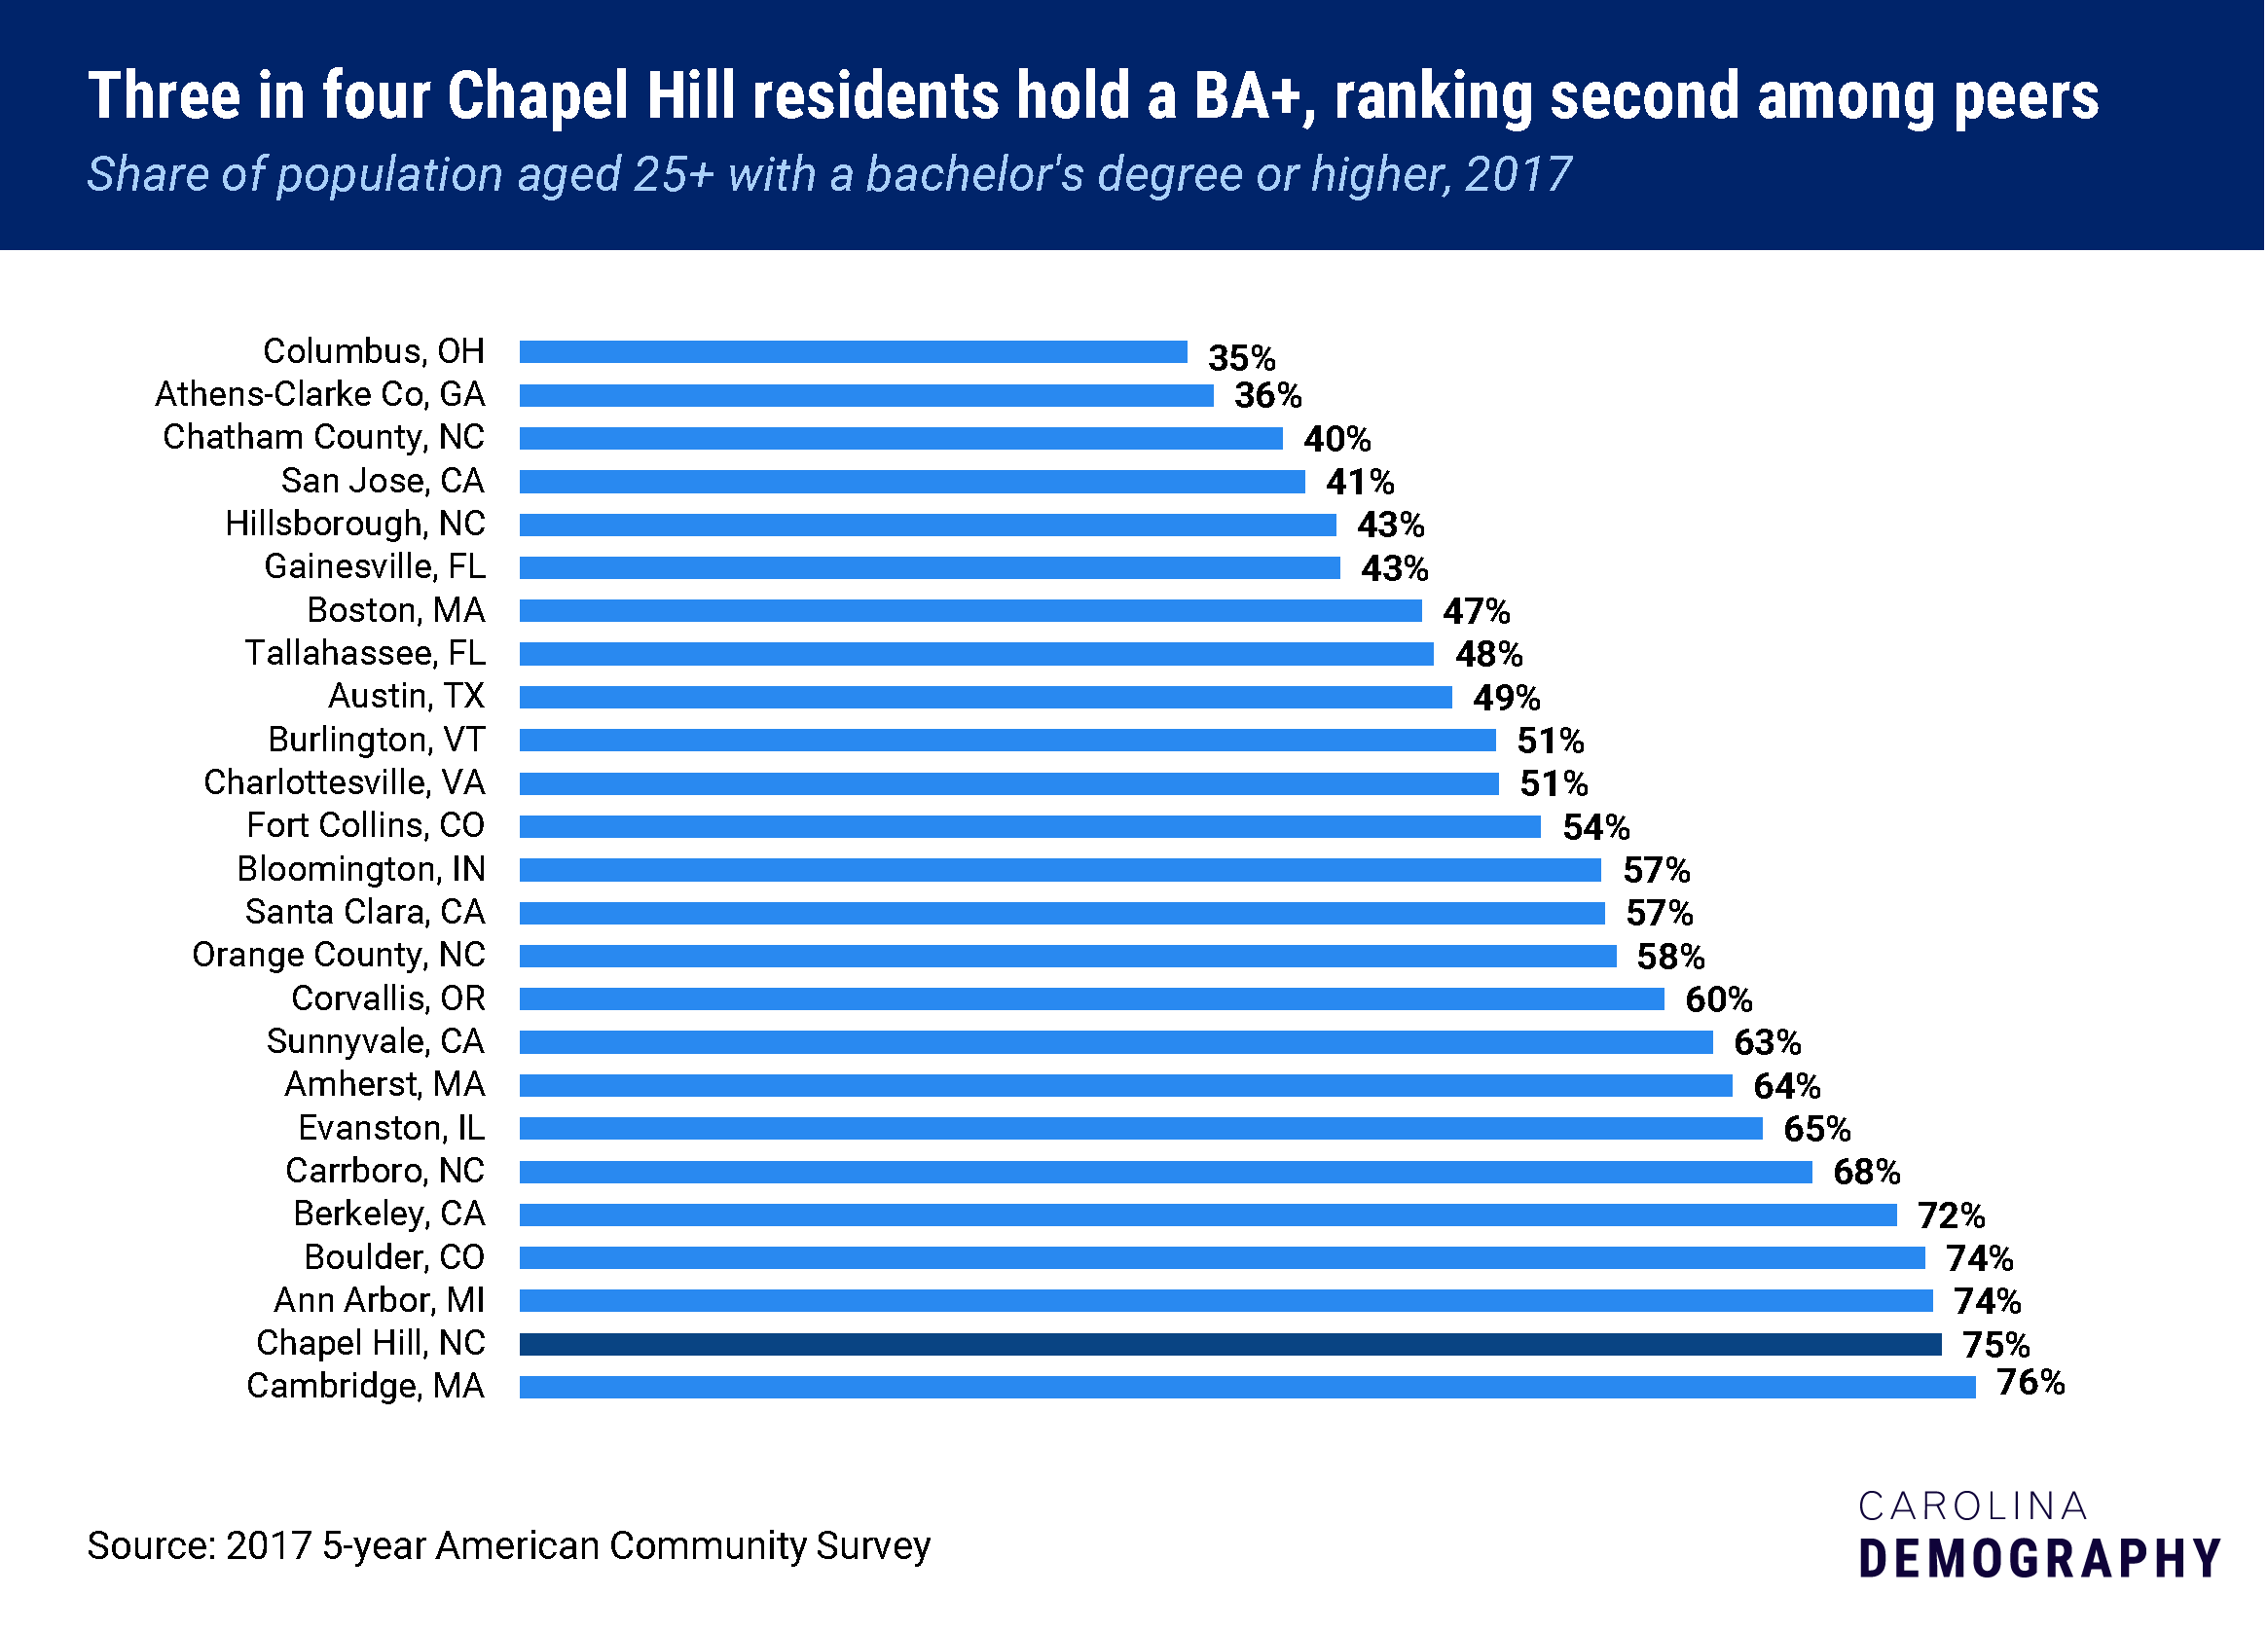
Due to its abundance of colleges, research facilities, and tech companies, the Durham-Chapel Hill MSA often finds itself at the top of “Most Educated” lists. The Town of Chapel Hill clearly makes an impact on these rankings. Three in every four Chapel Hill residents (75%) age 25 and older had a bachelor’s degree or above in 2017 – greater than many of its peer communities.
Peer communities are defined as cities and towns that have similar socioeconomic characteristics as Chapel Hill, especially the presence of a major university or skilled employment sector. Compared to its peers, Chapel Hill ranked second only to Cambridge, Massachusetts where 77% of residents hold a four-year degree or higher.
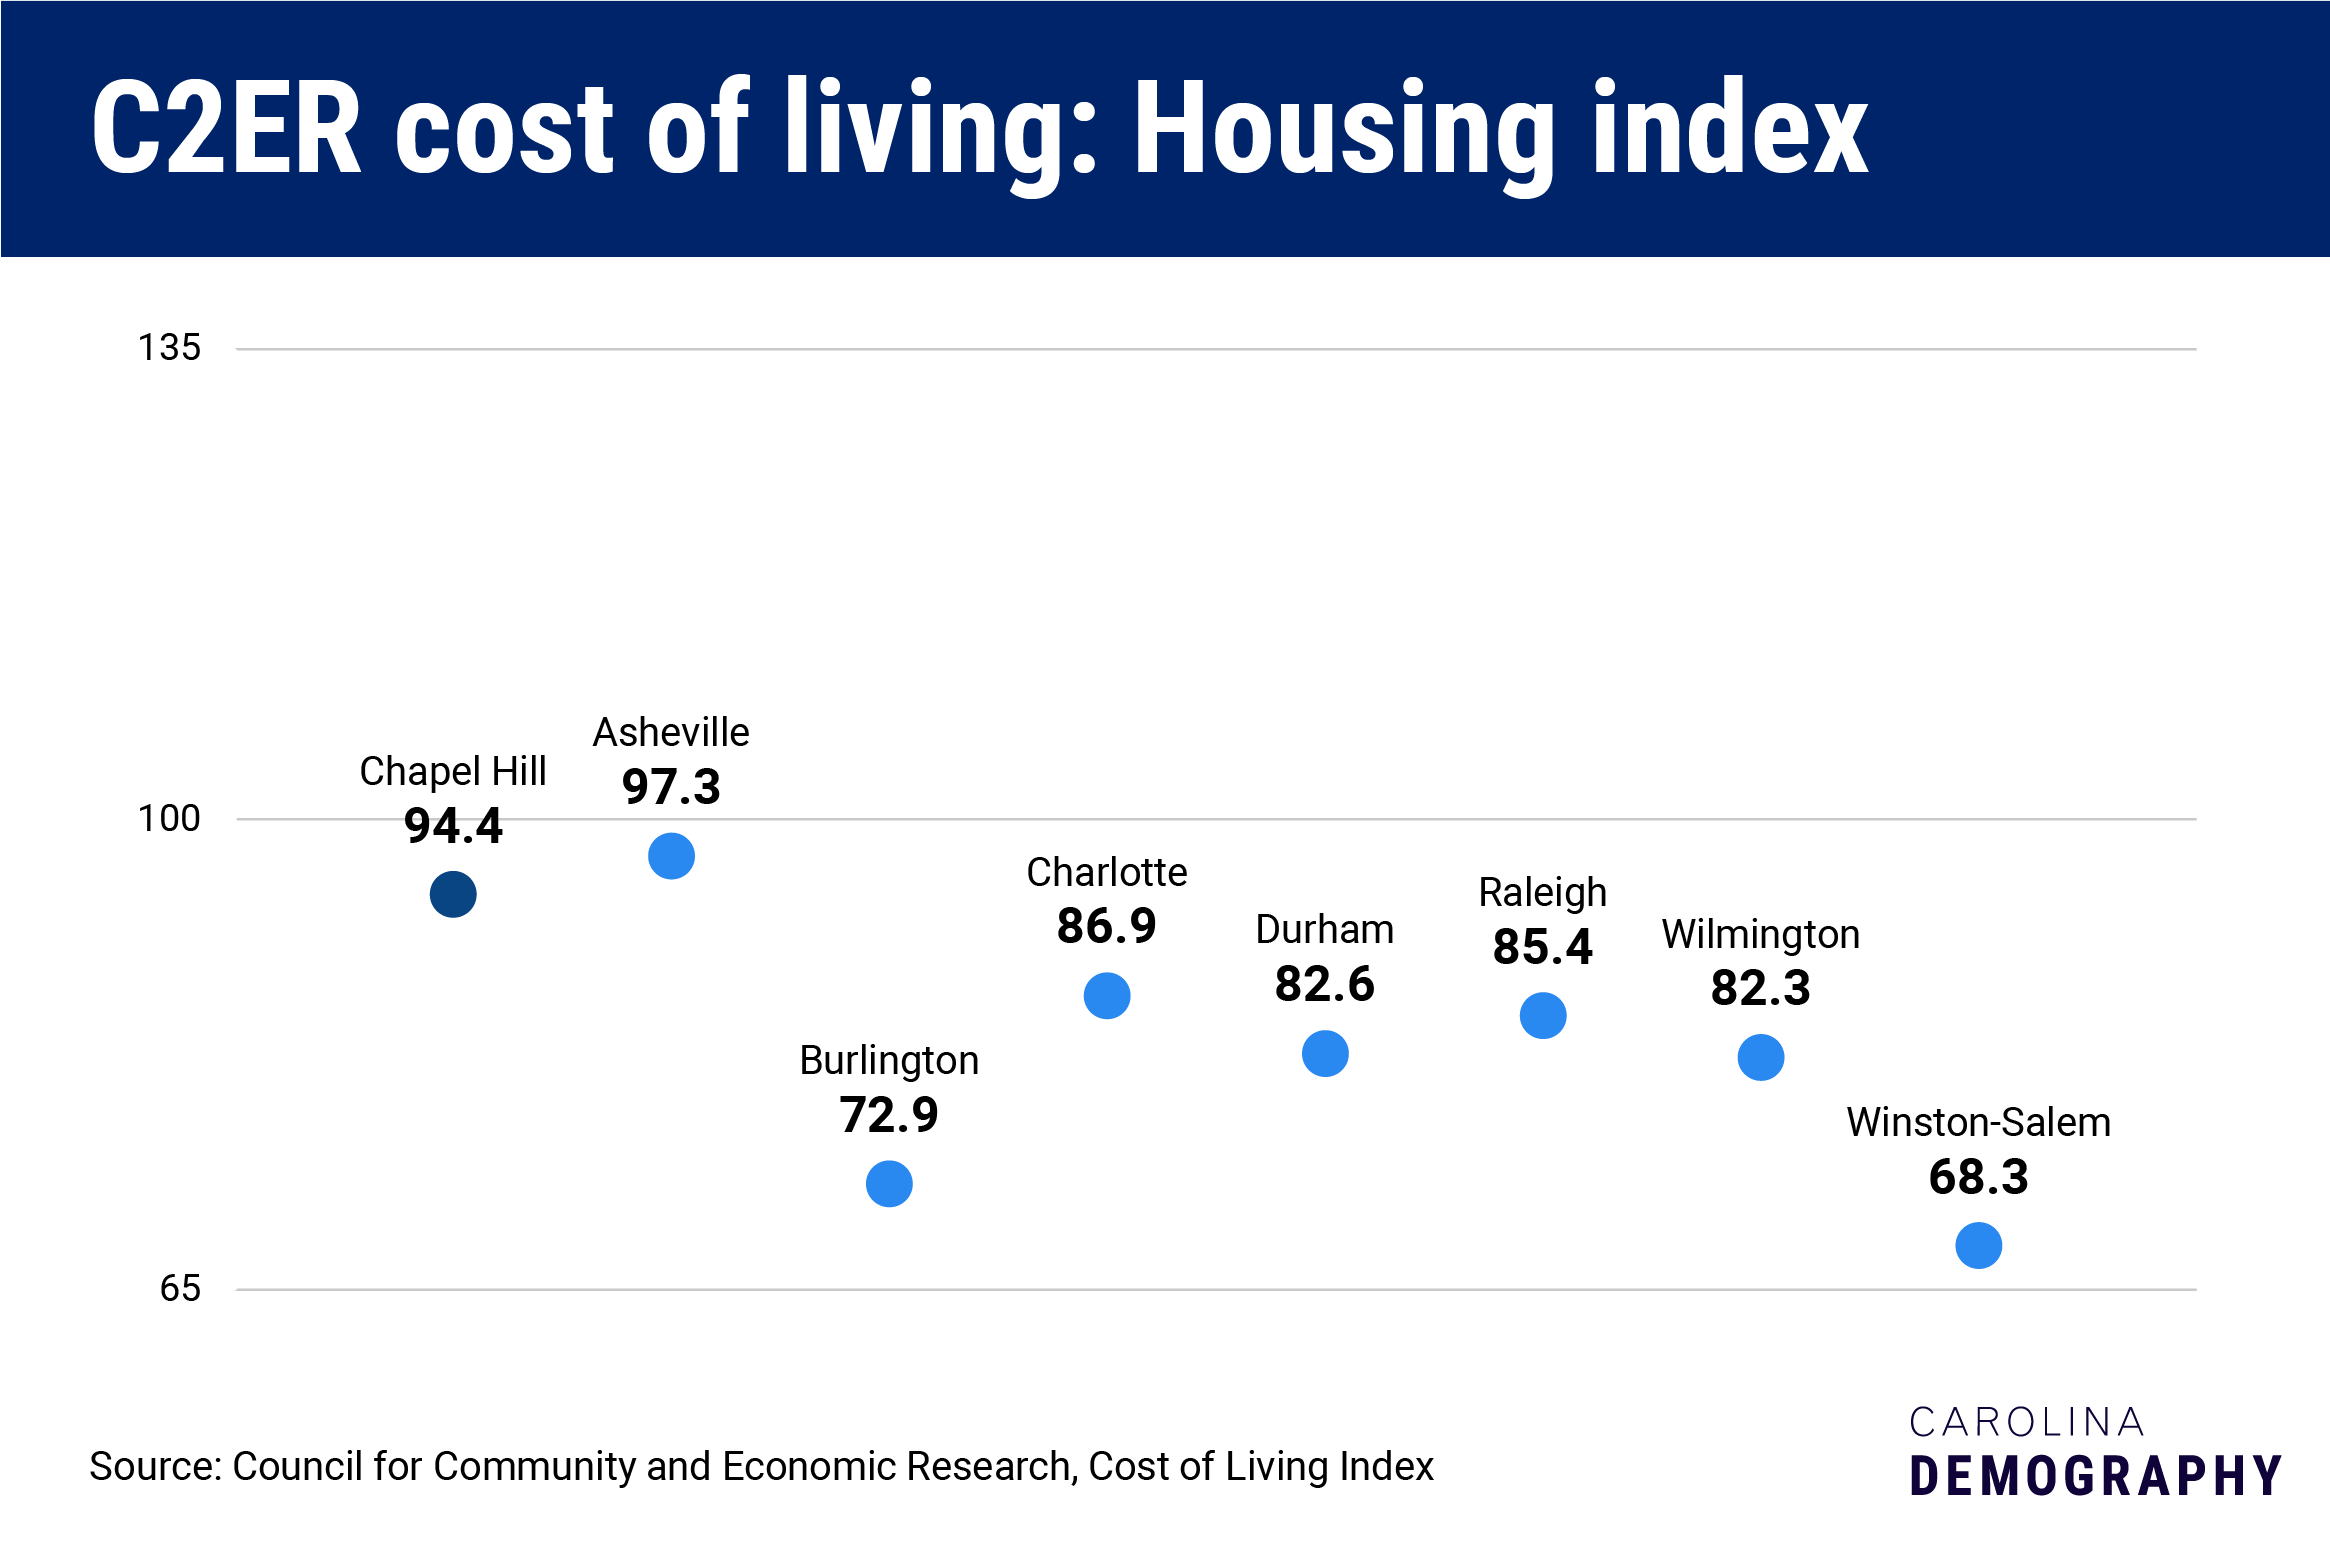
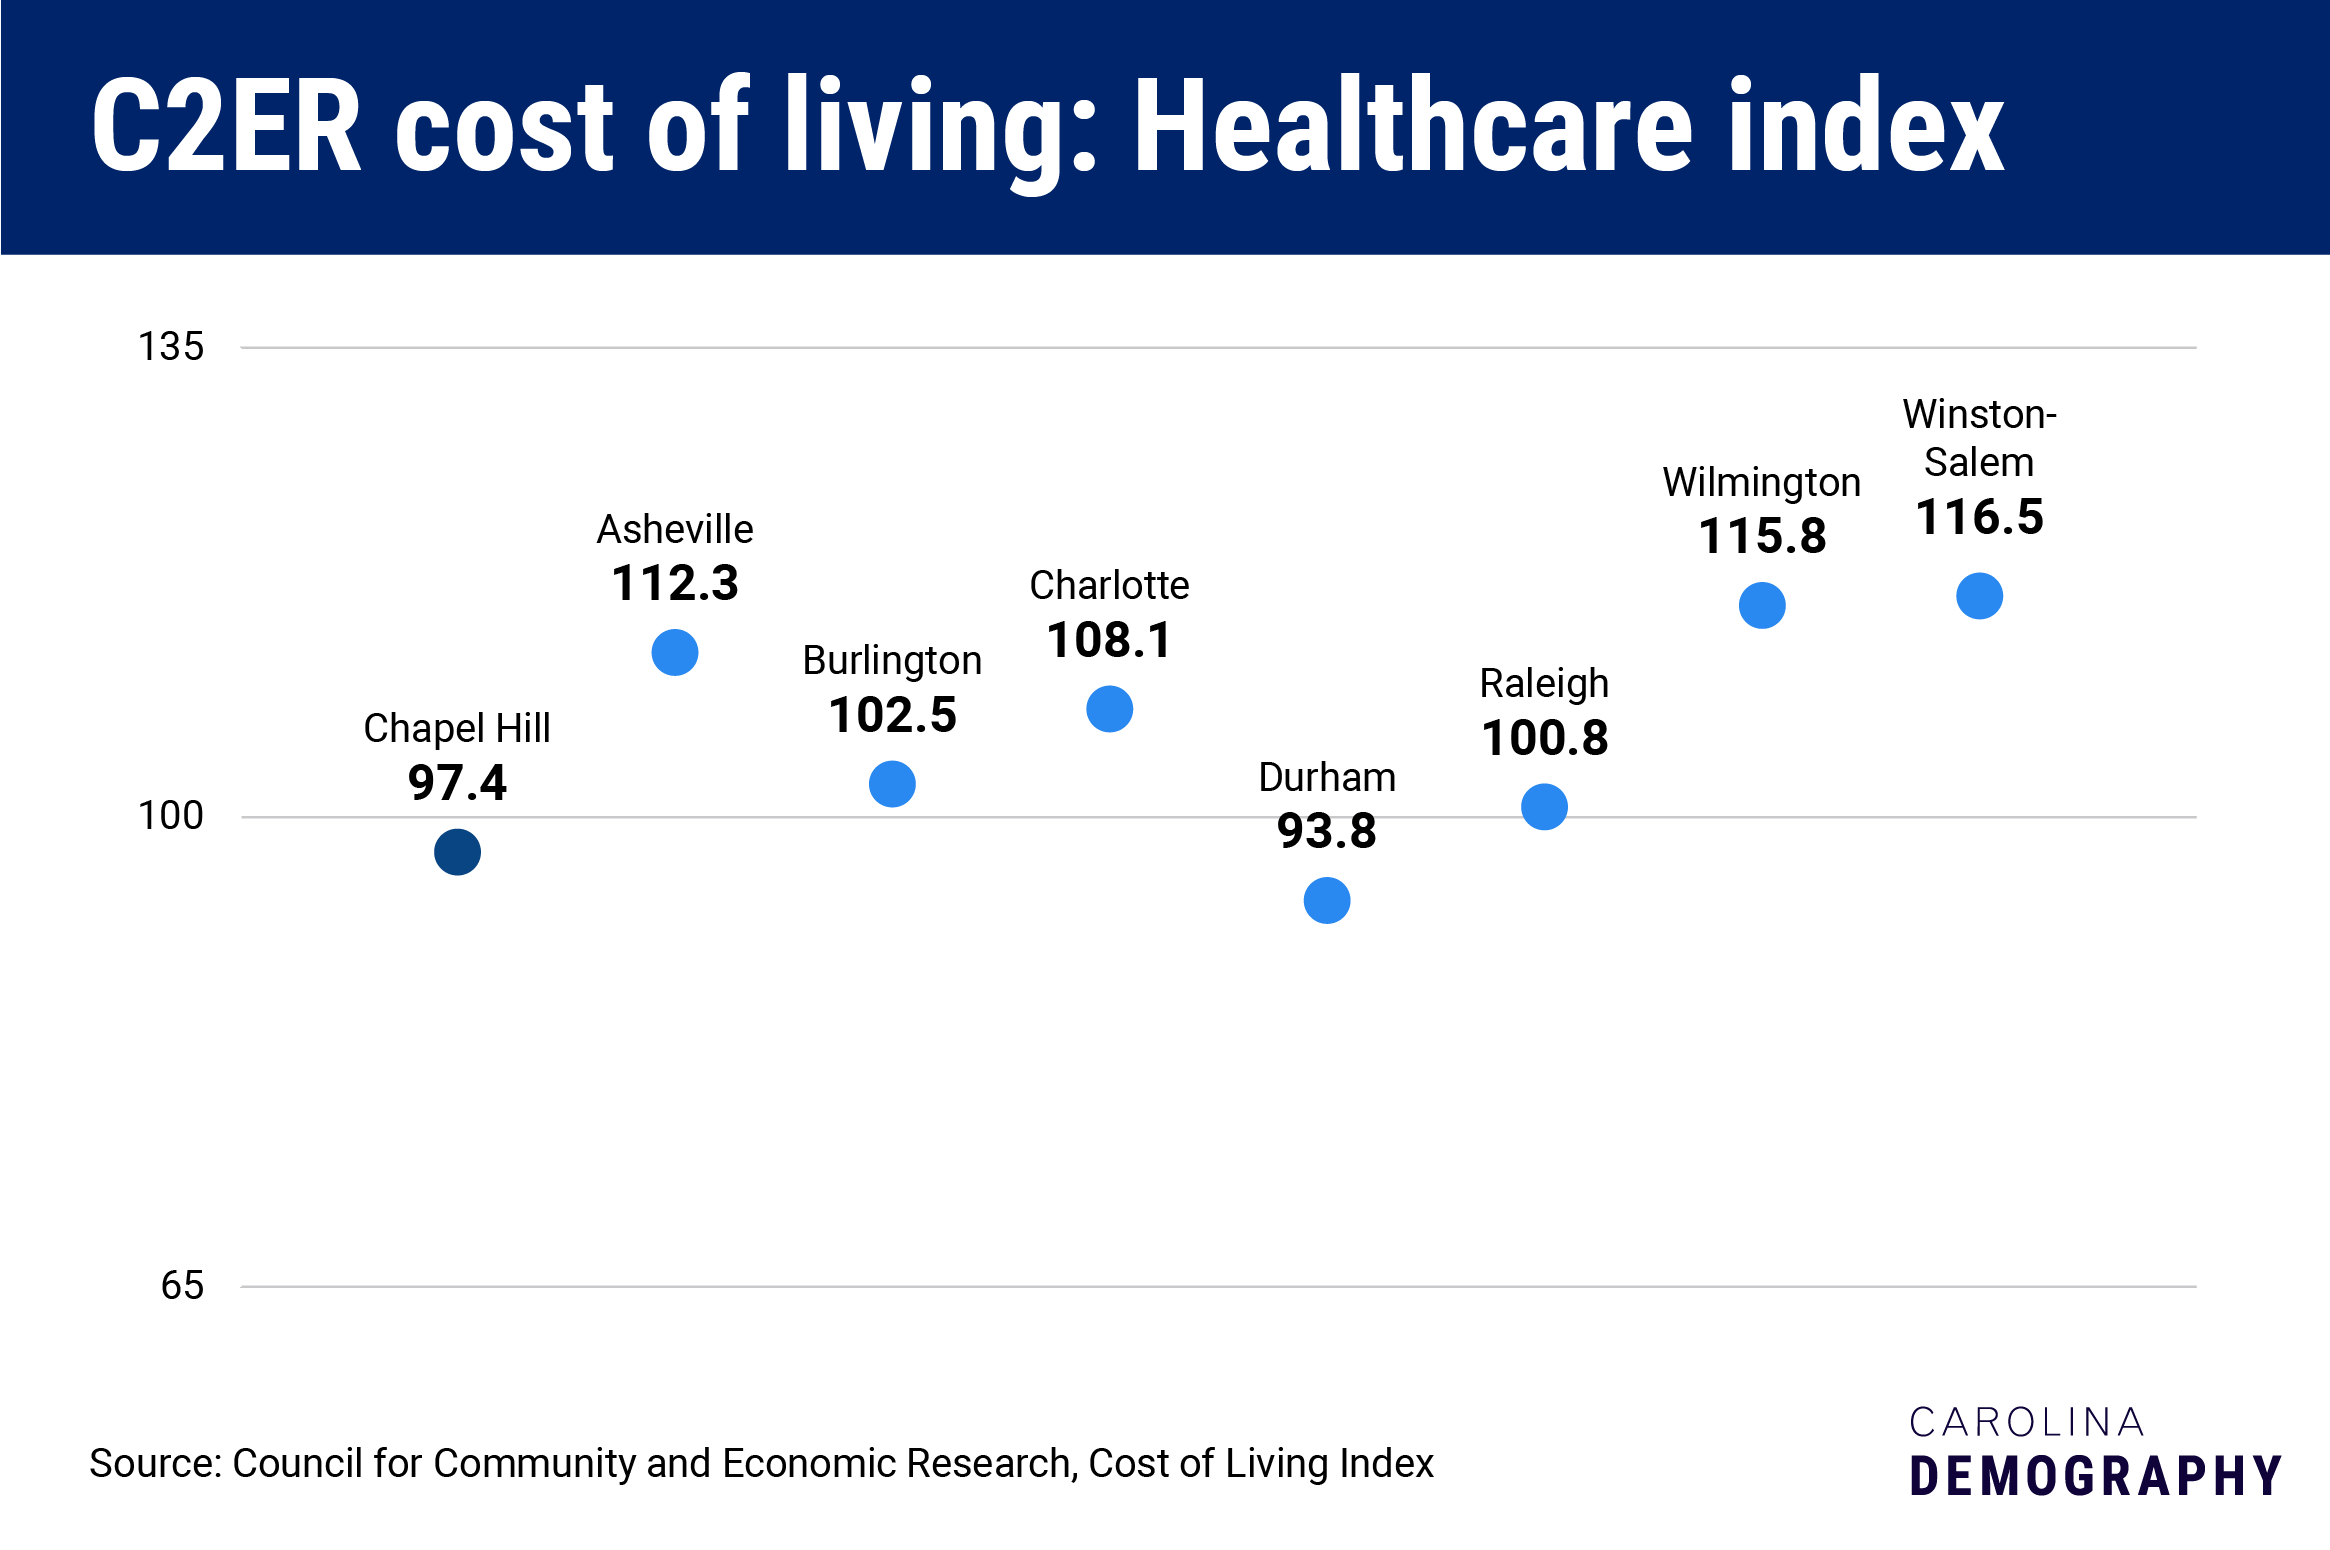
The Council for Community and Economic Research releases a quarterly Cost of Living index, which allows for city-to-city cost comparisons of major consumer expenses. According to their website, the “average for all participating places equals 100, and each participant’s index is read as a percentage of the average for all places”.
The cost of housing in Chapel Hill was ranked second-highest among NC’s largest cities. At 94.4, Chapel Hill ranked second to Asheville (97.3) in the housing cost index. All major cities in the state ranked below 100, however, indicating the overall lower cost of living in North Carolina. Housing is still cheaper here than the average of all participating US cities and towns, but in Chapel Hill, it is not by much.
Compared to other major NC cities, Chapel Hill had the second-lowest healthcare cost ranking (97.4) in the state. Below that was Durham, who had the lowest healthcare cost ranking at 93.8. These two places were also the only large municipalities where healthcare costs fell below the national average. All other major cities had rankings exceeding 100, indicating that healthcare costs were higher in those places than the average of all participating cities in the United States.
The presence of UNC-Chapel Hill and Duke’s research hospitals may play a role in the smaller medical cost burden in these two cities.
Data from the Orange Water and Sewer Authority (OWASA) indicates that water consumption has been trending downward for roughly a decade. Between 1986 and the early 2000s, water sales grew faster than OWASA customer accounts, with water usage peaking at roughly 8.3 million gallons per day in 1999. Despite continuous growth in customer accounts since 2002 – rising from 18,400 to 21,600 accounts over the past 16 years – average water usage has actually been on a gradual decline since then.
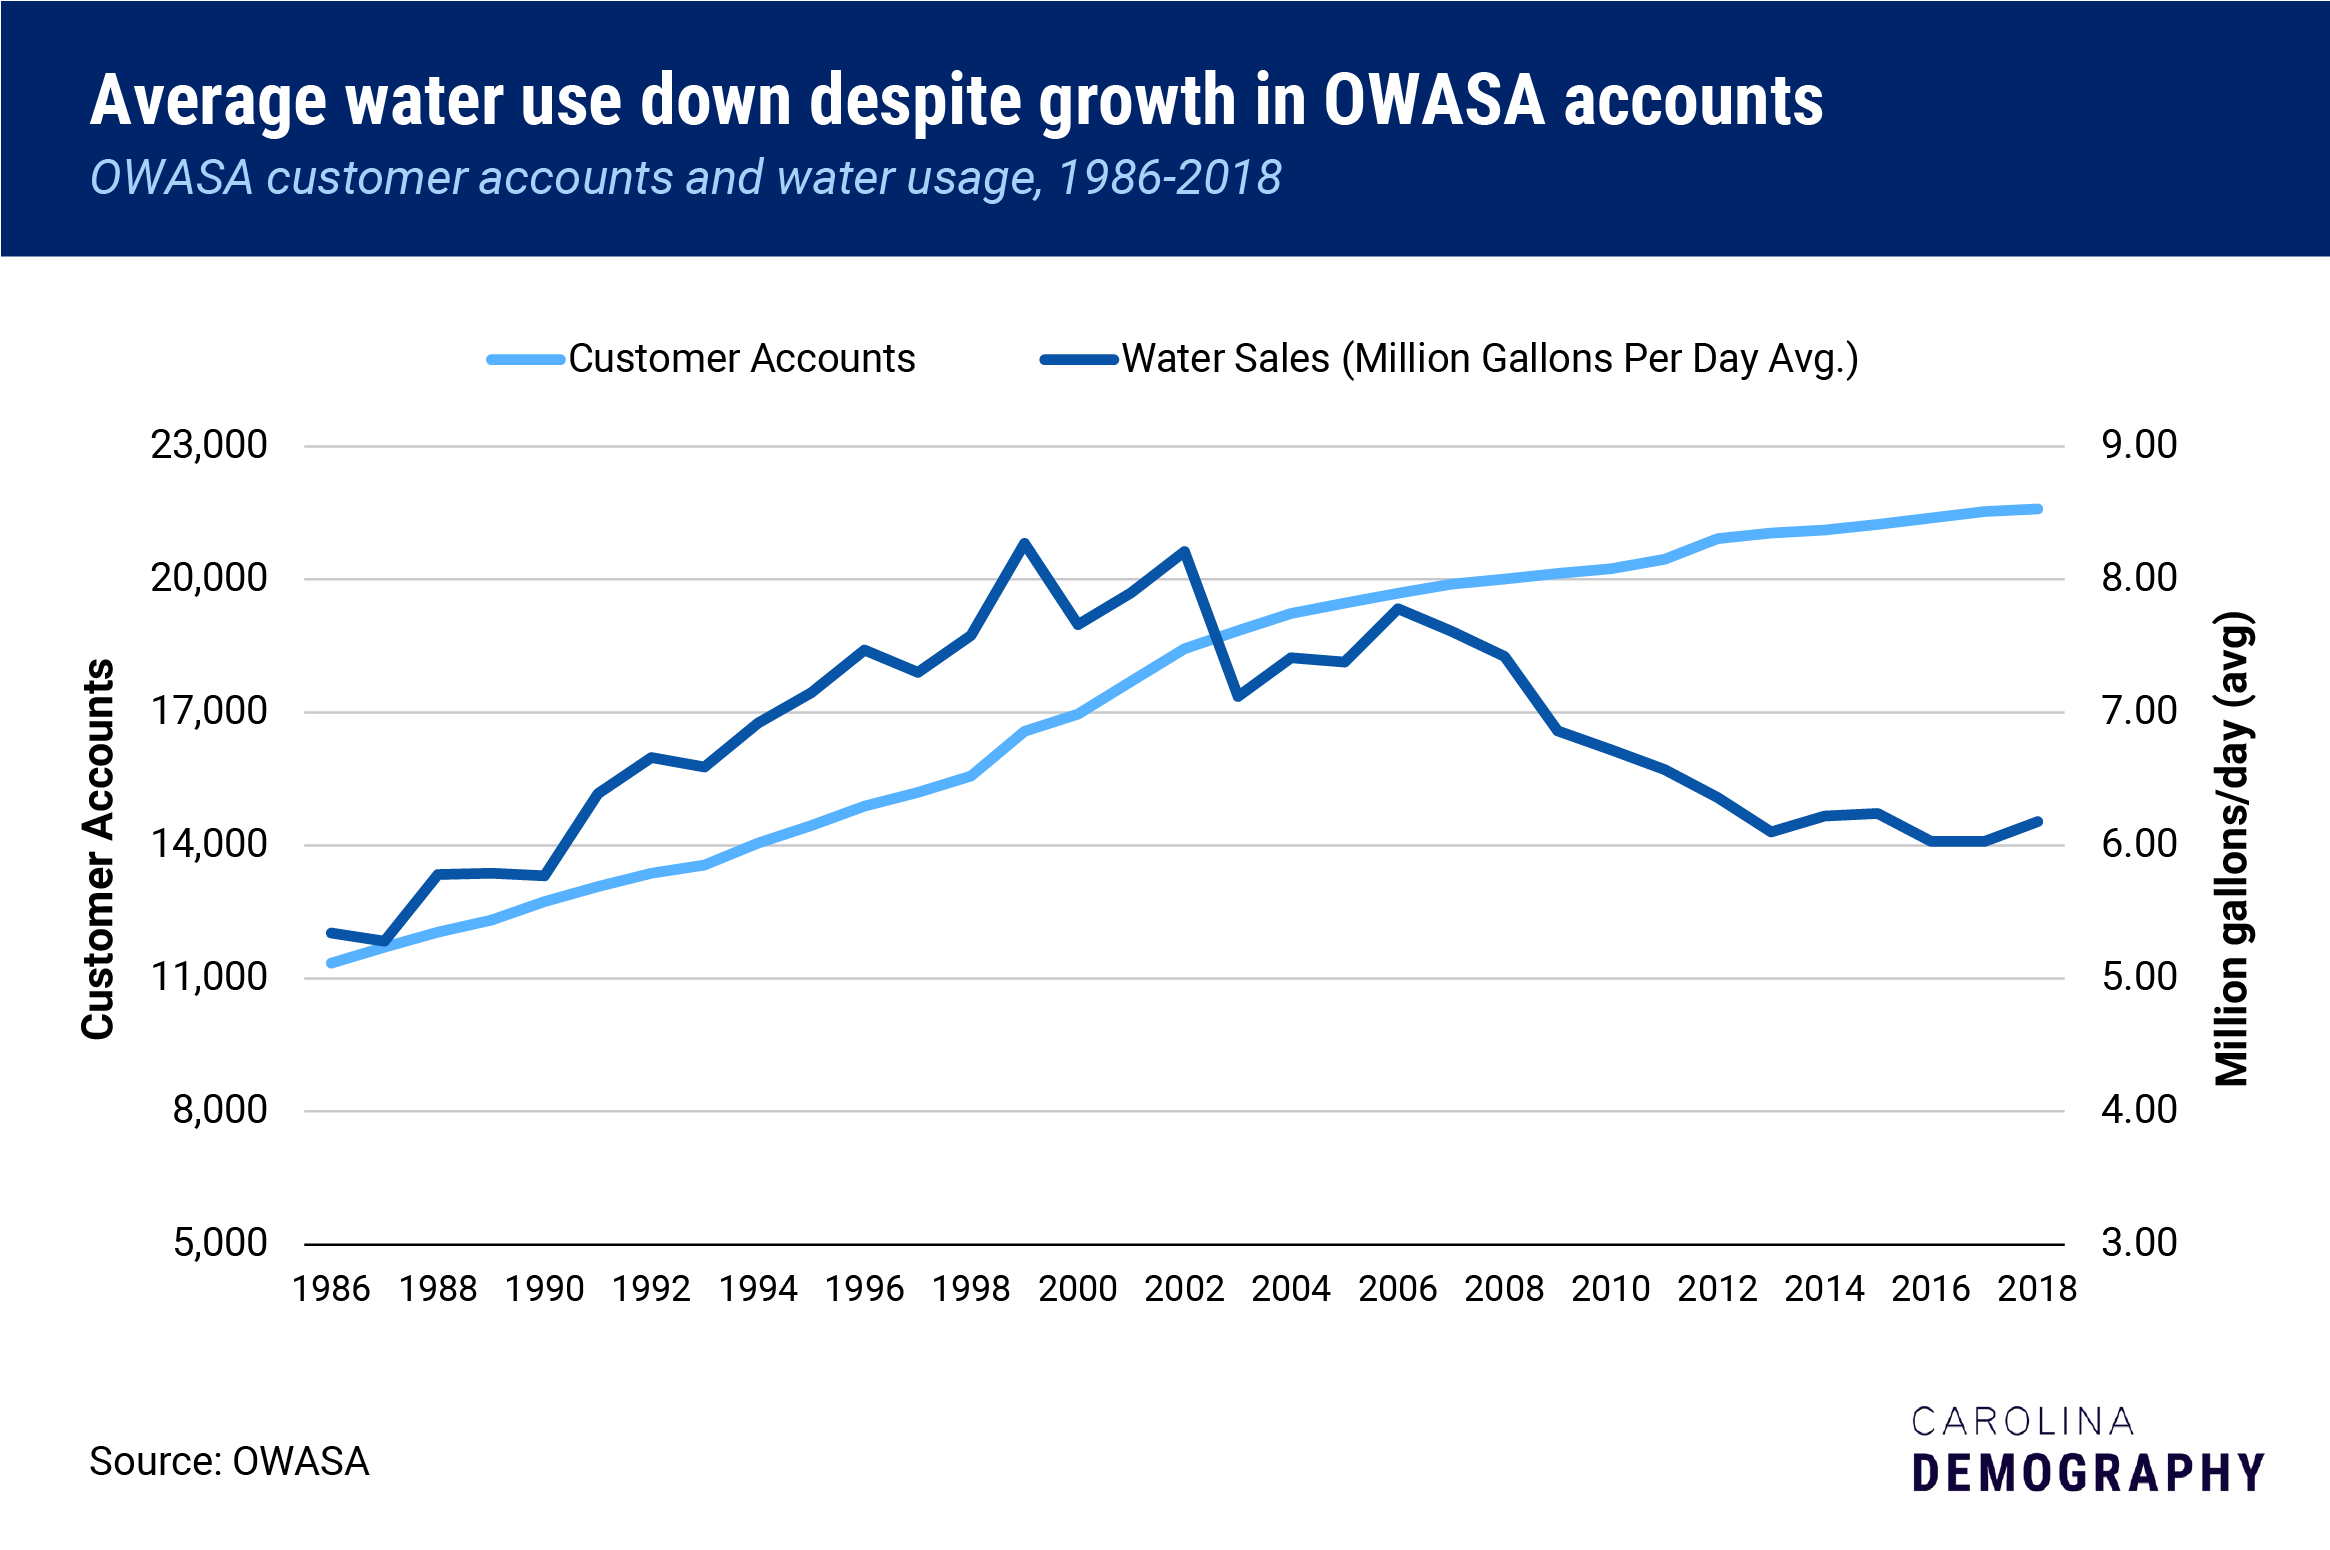
Various efforts may account for this decline. The University of North Carolina at Chapel Hill introduced its Three Zeros Initiative, which tracks the university’s contributions to landfills, greenhouse gas emissions, and water consumption. Water consumption has seen a steady decline at UNC, estimated to be down 46% from 2000 to 2017.
Residential consumption may also be on the decline, as more individuals become aware of their own ecological footprints. Over the years, apartments and other multi-unit housing structures have also been retrofitted to reduce consumption and improve efficiency. Together, these factors have made serious contributions to Chapel Hill’s decline in water usage.
We are looking forward to hearing more at this week’s State of the Community. And if you have additional demographic-related questions about Chapel Hill, Carrboro, or a different community in NC, please let us know.
*Note: The high growth in the 1940s reflects a change in where college students were counted in the 1950 Census. Previously, college students were counted at their parents’ home address. Starting with the 1950 Census, students were counted at their “usual residence” on April 1 of the census year. Thank you to Gerry Cohen, who pointed out the difficulty in comparing this decade with others following it. Growth appears abnormally high due to this methodological change.
Need help understanding population change and its impacts on your community or business? Carolina Demography offers demographic research tailored to your needs.
Contact us today for a free initial consultation.
Contact UsCategories: NC in Focus
Tags: Carrboro, Chapel Hill, North Carolina, population growth

The Center for Women’s Health Research (CWHR) at the University of North Carolina School of Medicine released the 12th edition of our North Carolina Women’s Health Report Card on May 9, 2022. This document is a progress report on the…

Dr. Krista Perreira is a health economist who studies disparities in health, education, and economic well-being. In collaboration with the Urban Institute, she recently co-led a study funded by the Kate B. Reynolds Foundation to study barriers to access to…

Our material helped the NC Local News Lab Fund better understand and then prioritize their funding to better serve existing and future grant recipients in North Carolina. The North Carolina Local News Lab Fund was established in 2017 to strengthen…
Your support is critical to our mission of measuring, understanding, and predicting population change and its impact. Donate to Carolina Demography today.