
Between 2017 and 2018, North Carolina gained nearly 113,000 new residents according to the U.S. Census Bureau.
Looking specifically at race and ethnicity, nearly one-third (32%) of the state’s population growth since 2017 was from growth in the white population, which grew by 36,466 persons between 2017 and 2018. The state’s population of Hispanic or Latino residents had the second largest numeric increase over this period, growing by 32,355 persons (29% of statewide growth). The black population grew by 22,722 over this same time period while the Asian and Pacific Islander population increased by 14,302. The populations of individuals of two or more races (6,355) and American Indian (620) also increased over this time period.
As of 2018, North Carolina’s population was:
Here are some of the county-specific highlights for each of these major racial/ethnic groups within the state:
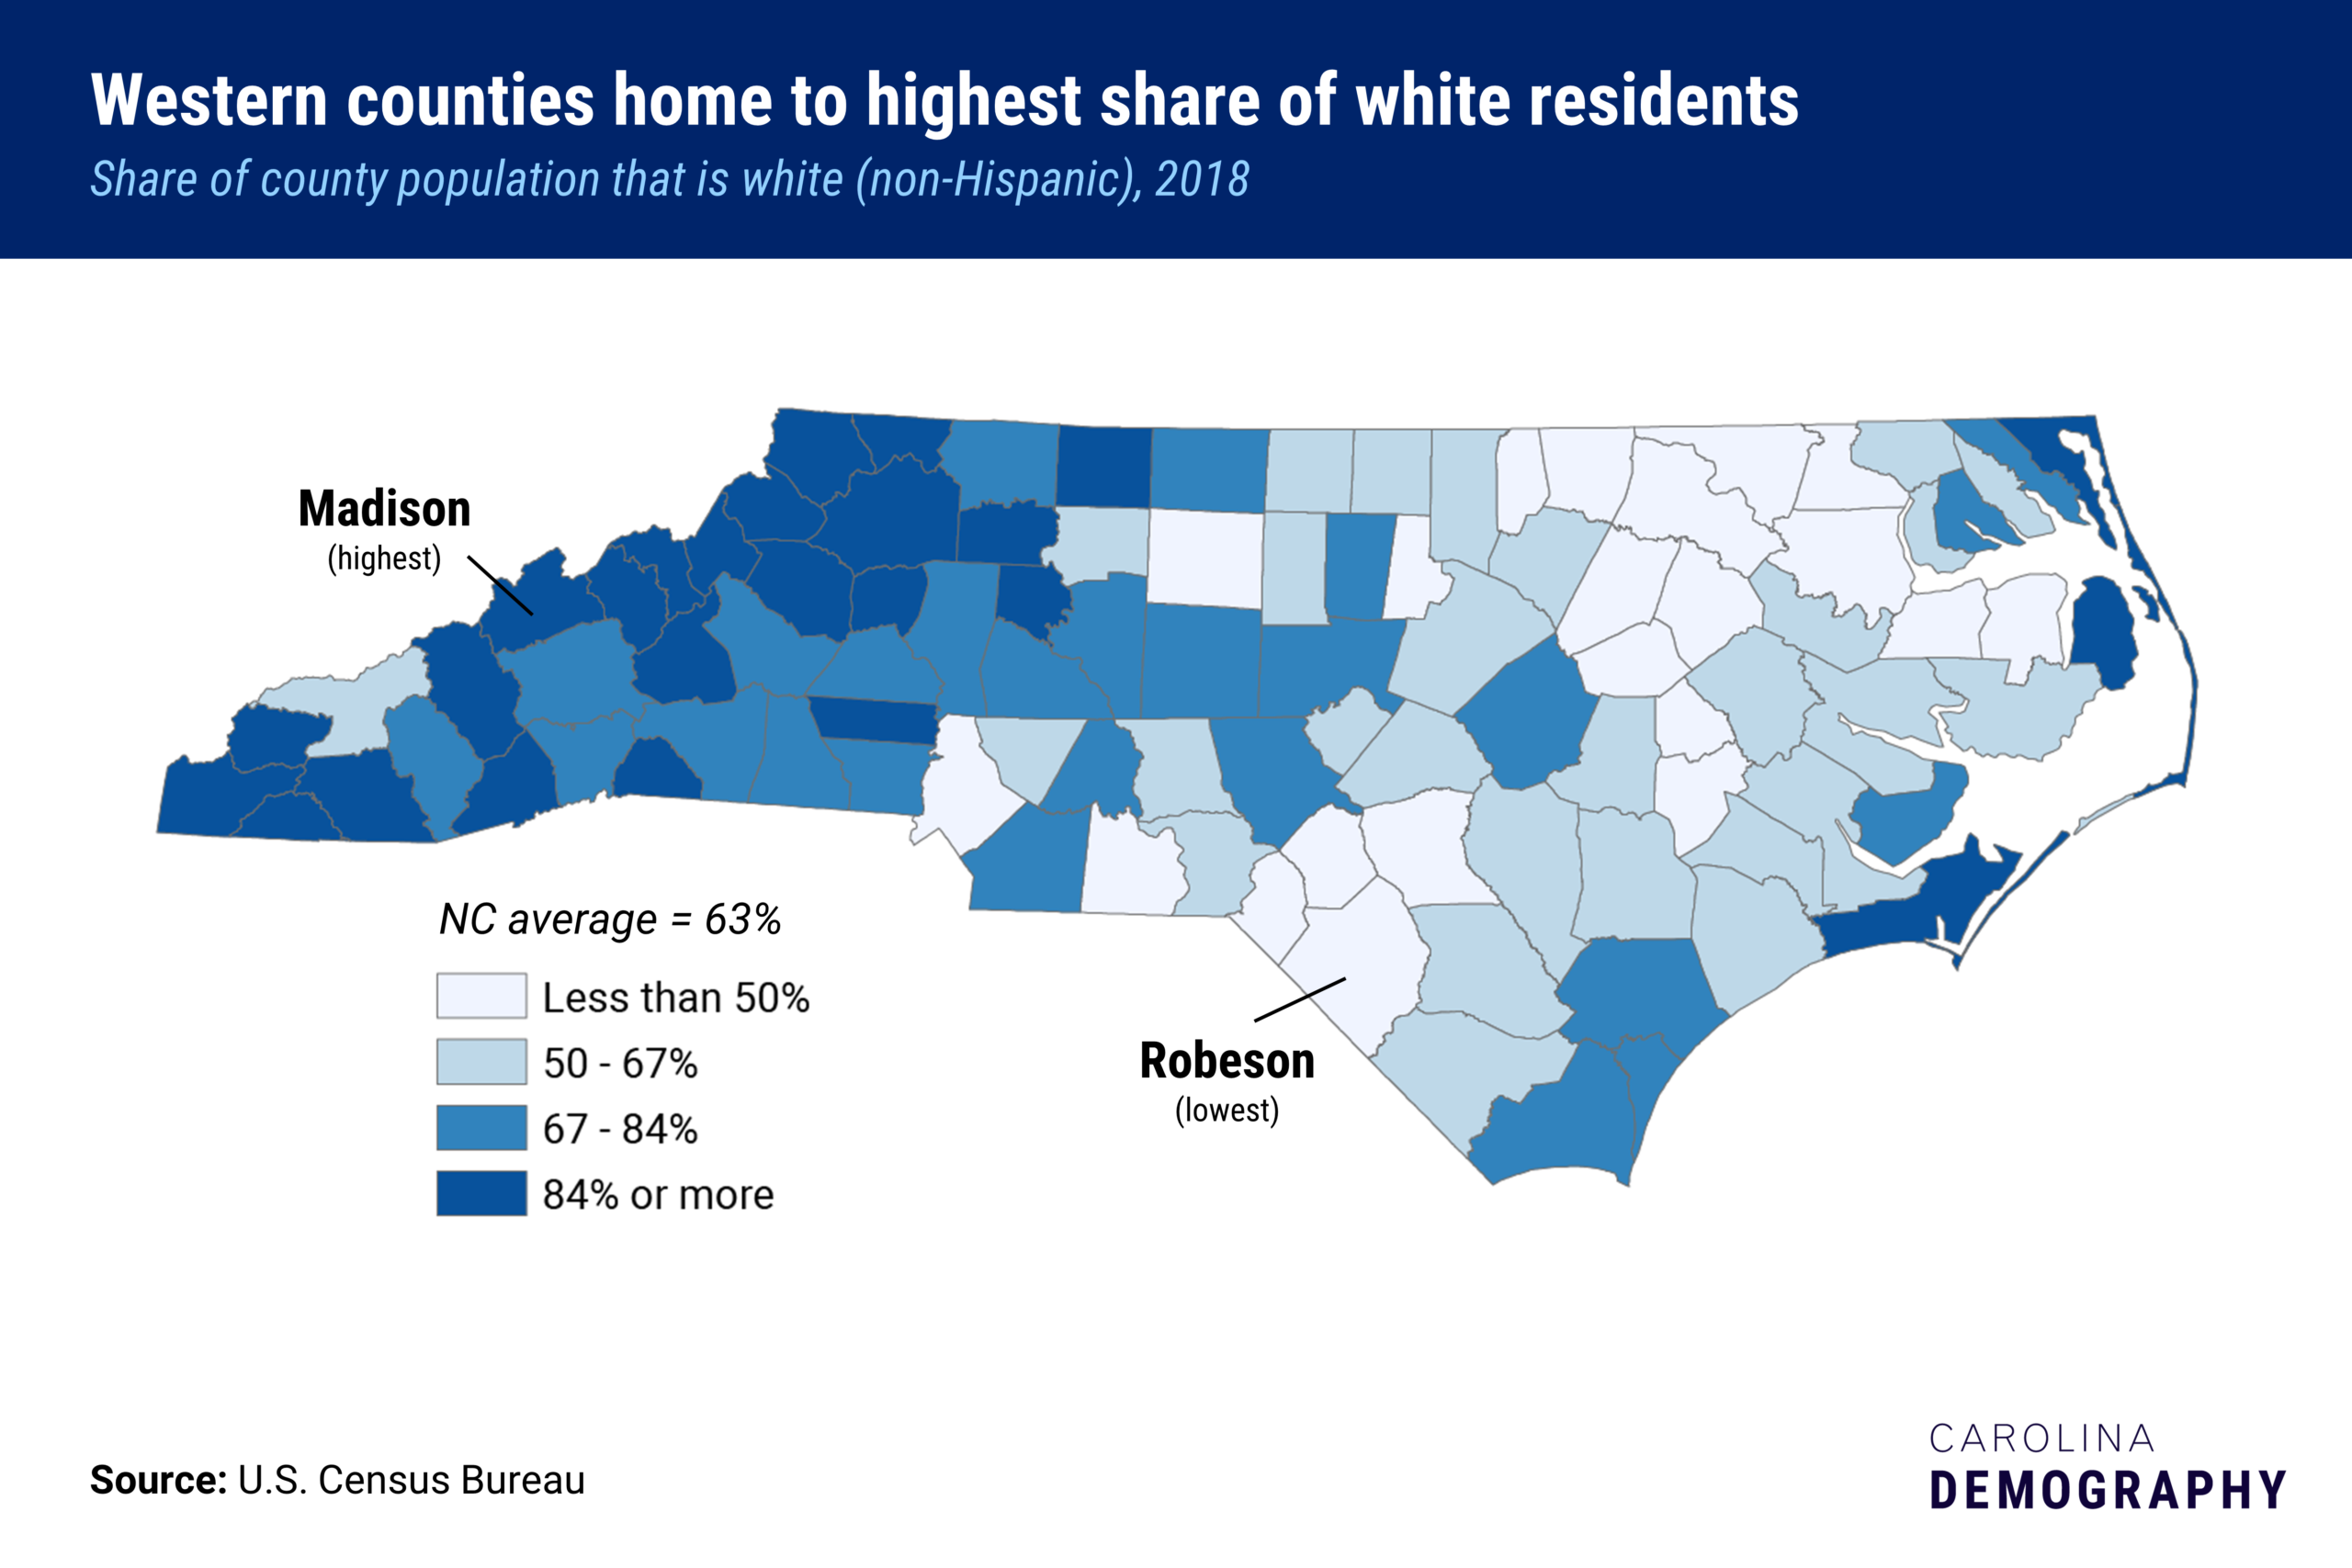
Wake had the largest non-Hispanic white population of any North Carolina county in 2018 (653,485) and the largest increase since 2017 (8,049). In 10 counties, the non-Hispanic white population was more than 90% of the total population in 2018. Madison had the highest percentage white (94%).
Tyrell had the smallest non-Hispanic white population in 2018 (2,044). Robeson had the smallest proportion white in 2018 (25%). Between 2017 and 2018, the non-Hispanic white population declined in nearly half of North Carolina’s counties (46); Cumberland had the largest estimated decrease (-2,265) since 2017.
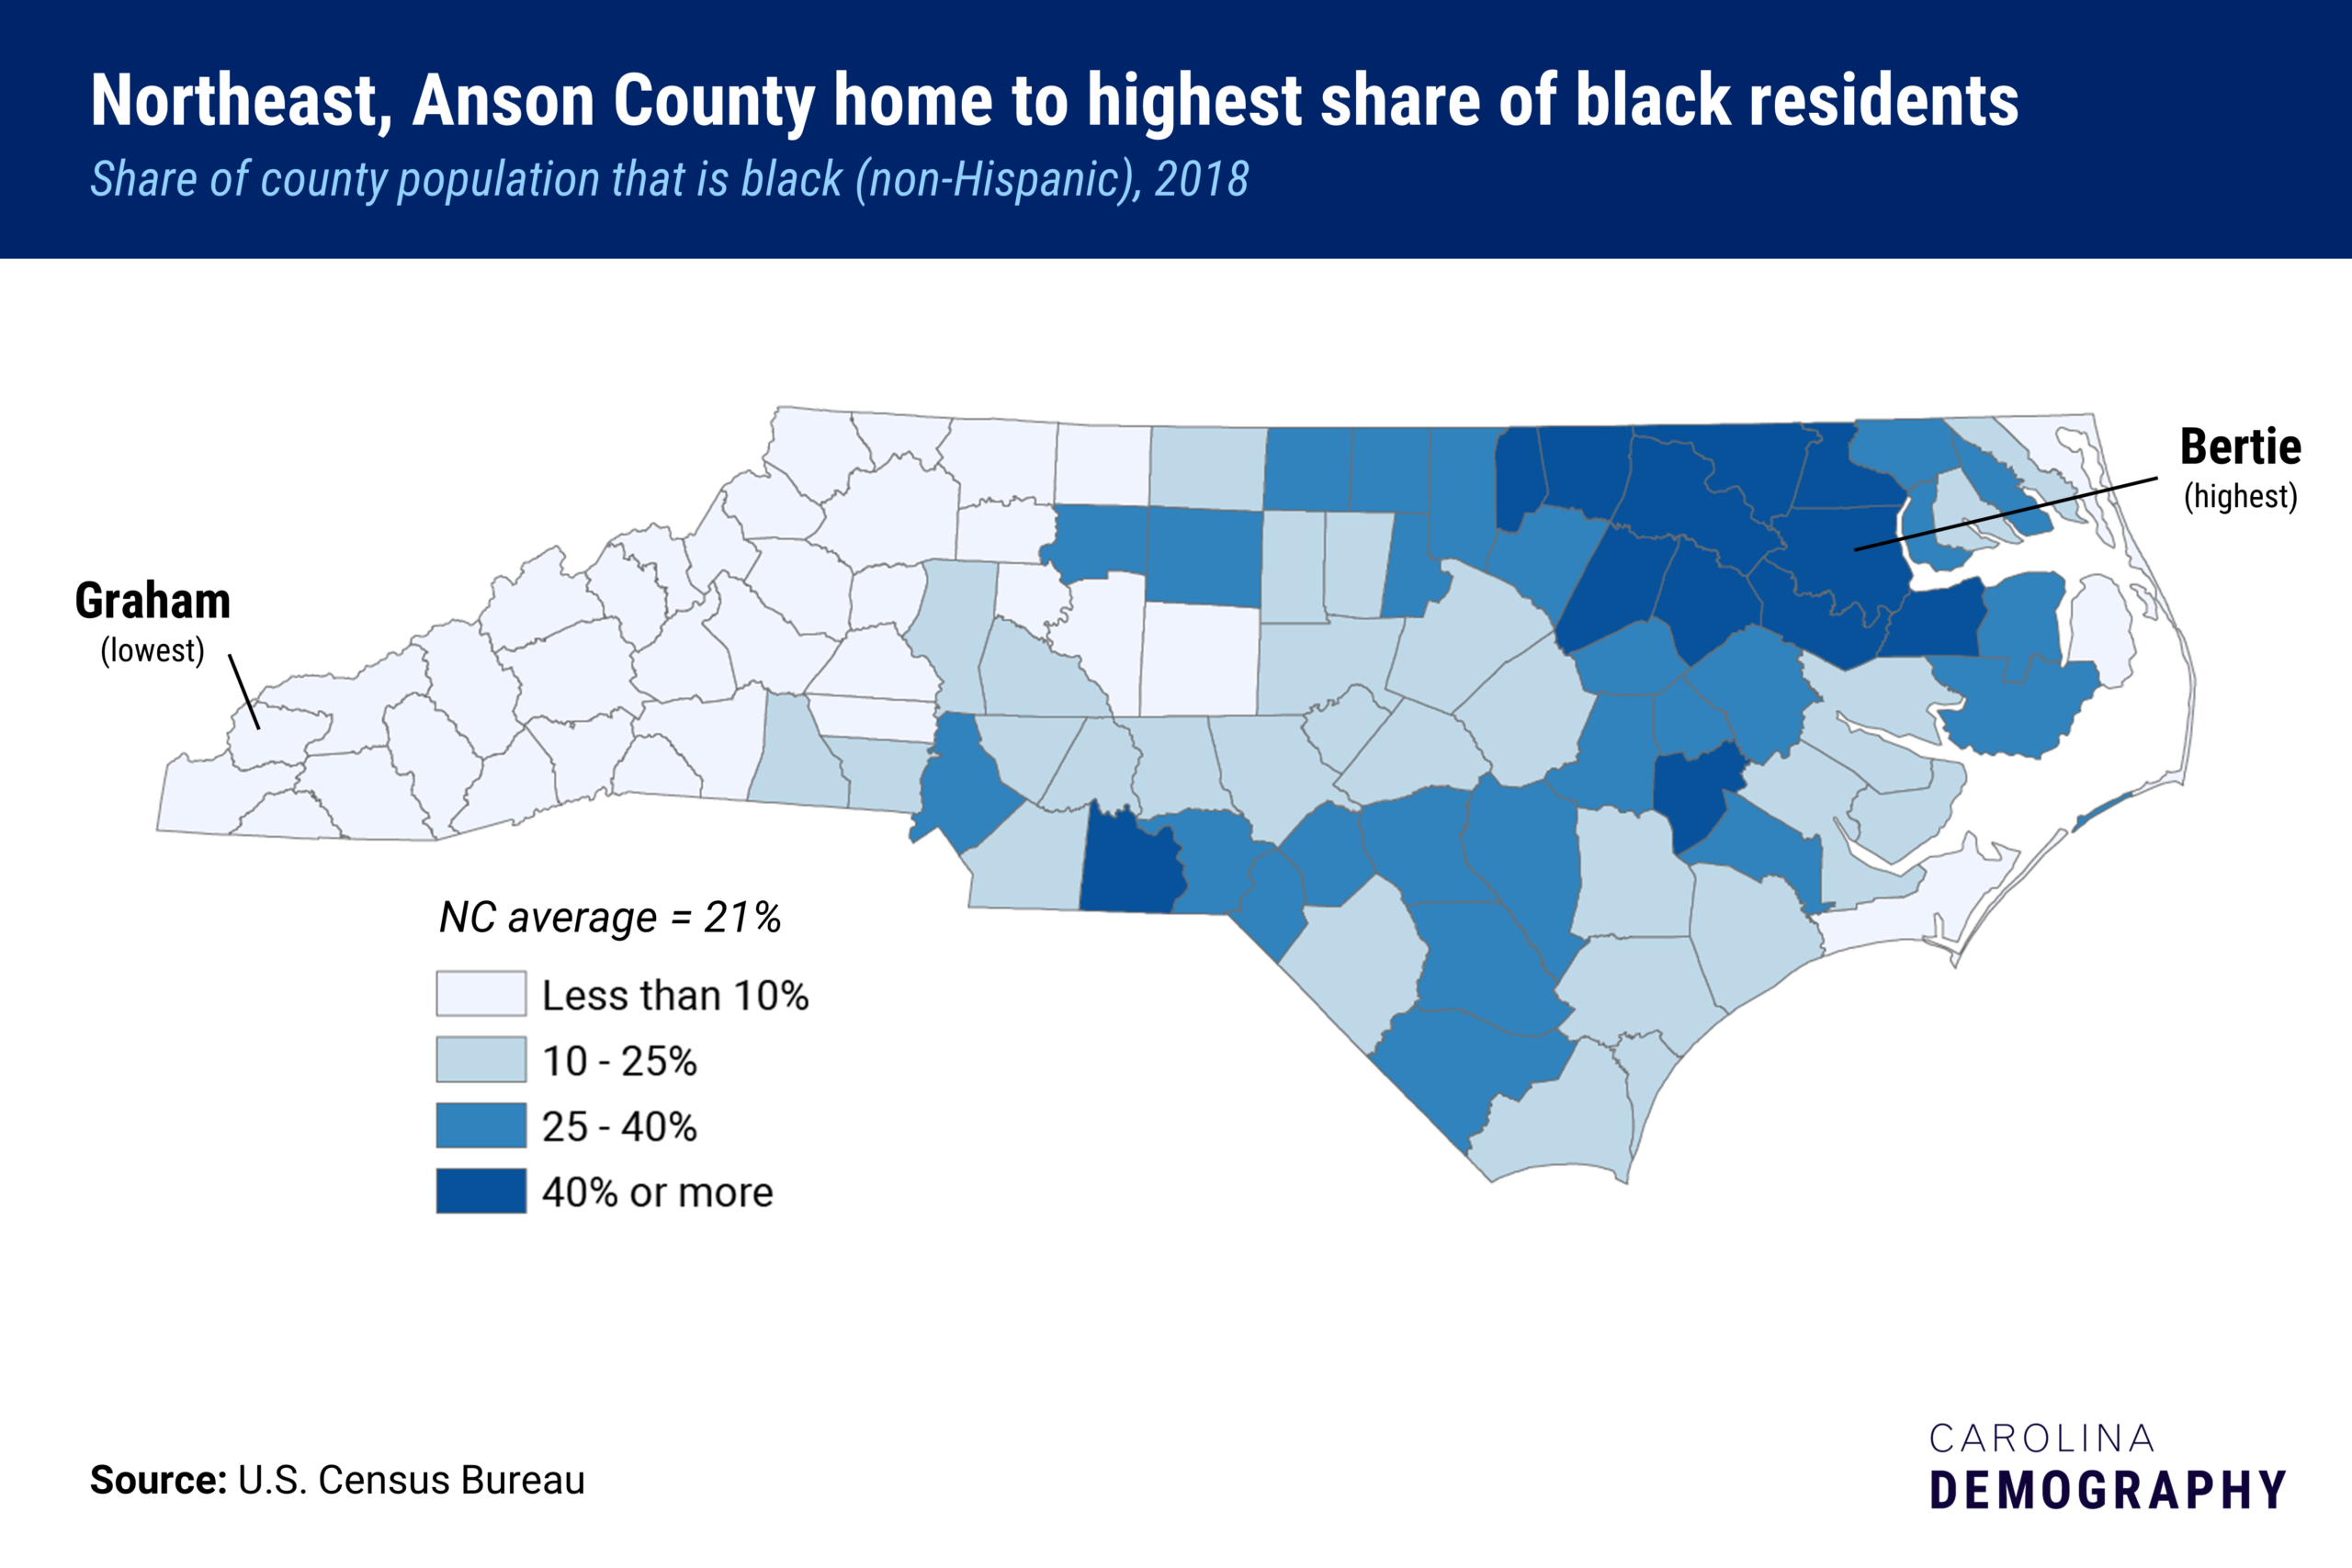
Mecklenburg had both the largest black population of any North Carolina county (344,243) and the largest numeric increase since 2017 (6,122). Seven counties are majority black; Bertie has the highest percentage of black residents in the state (61%).
Graham had the smallest black population (37) in 2018, representing 0.4% of its population, the smallest proportion in the state. Mitchell also had fewer than 100 black residents in 2018. The black population declined in 44 of the state’s 100 counties; Edgecombe had the largest numeric decrease (-498) in its black population since 2017.
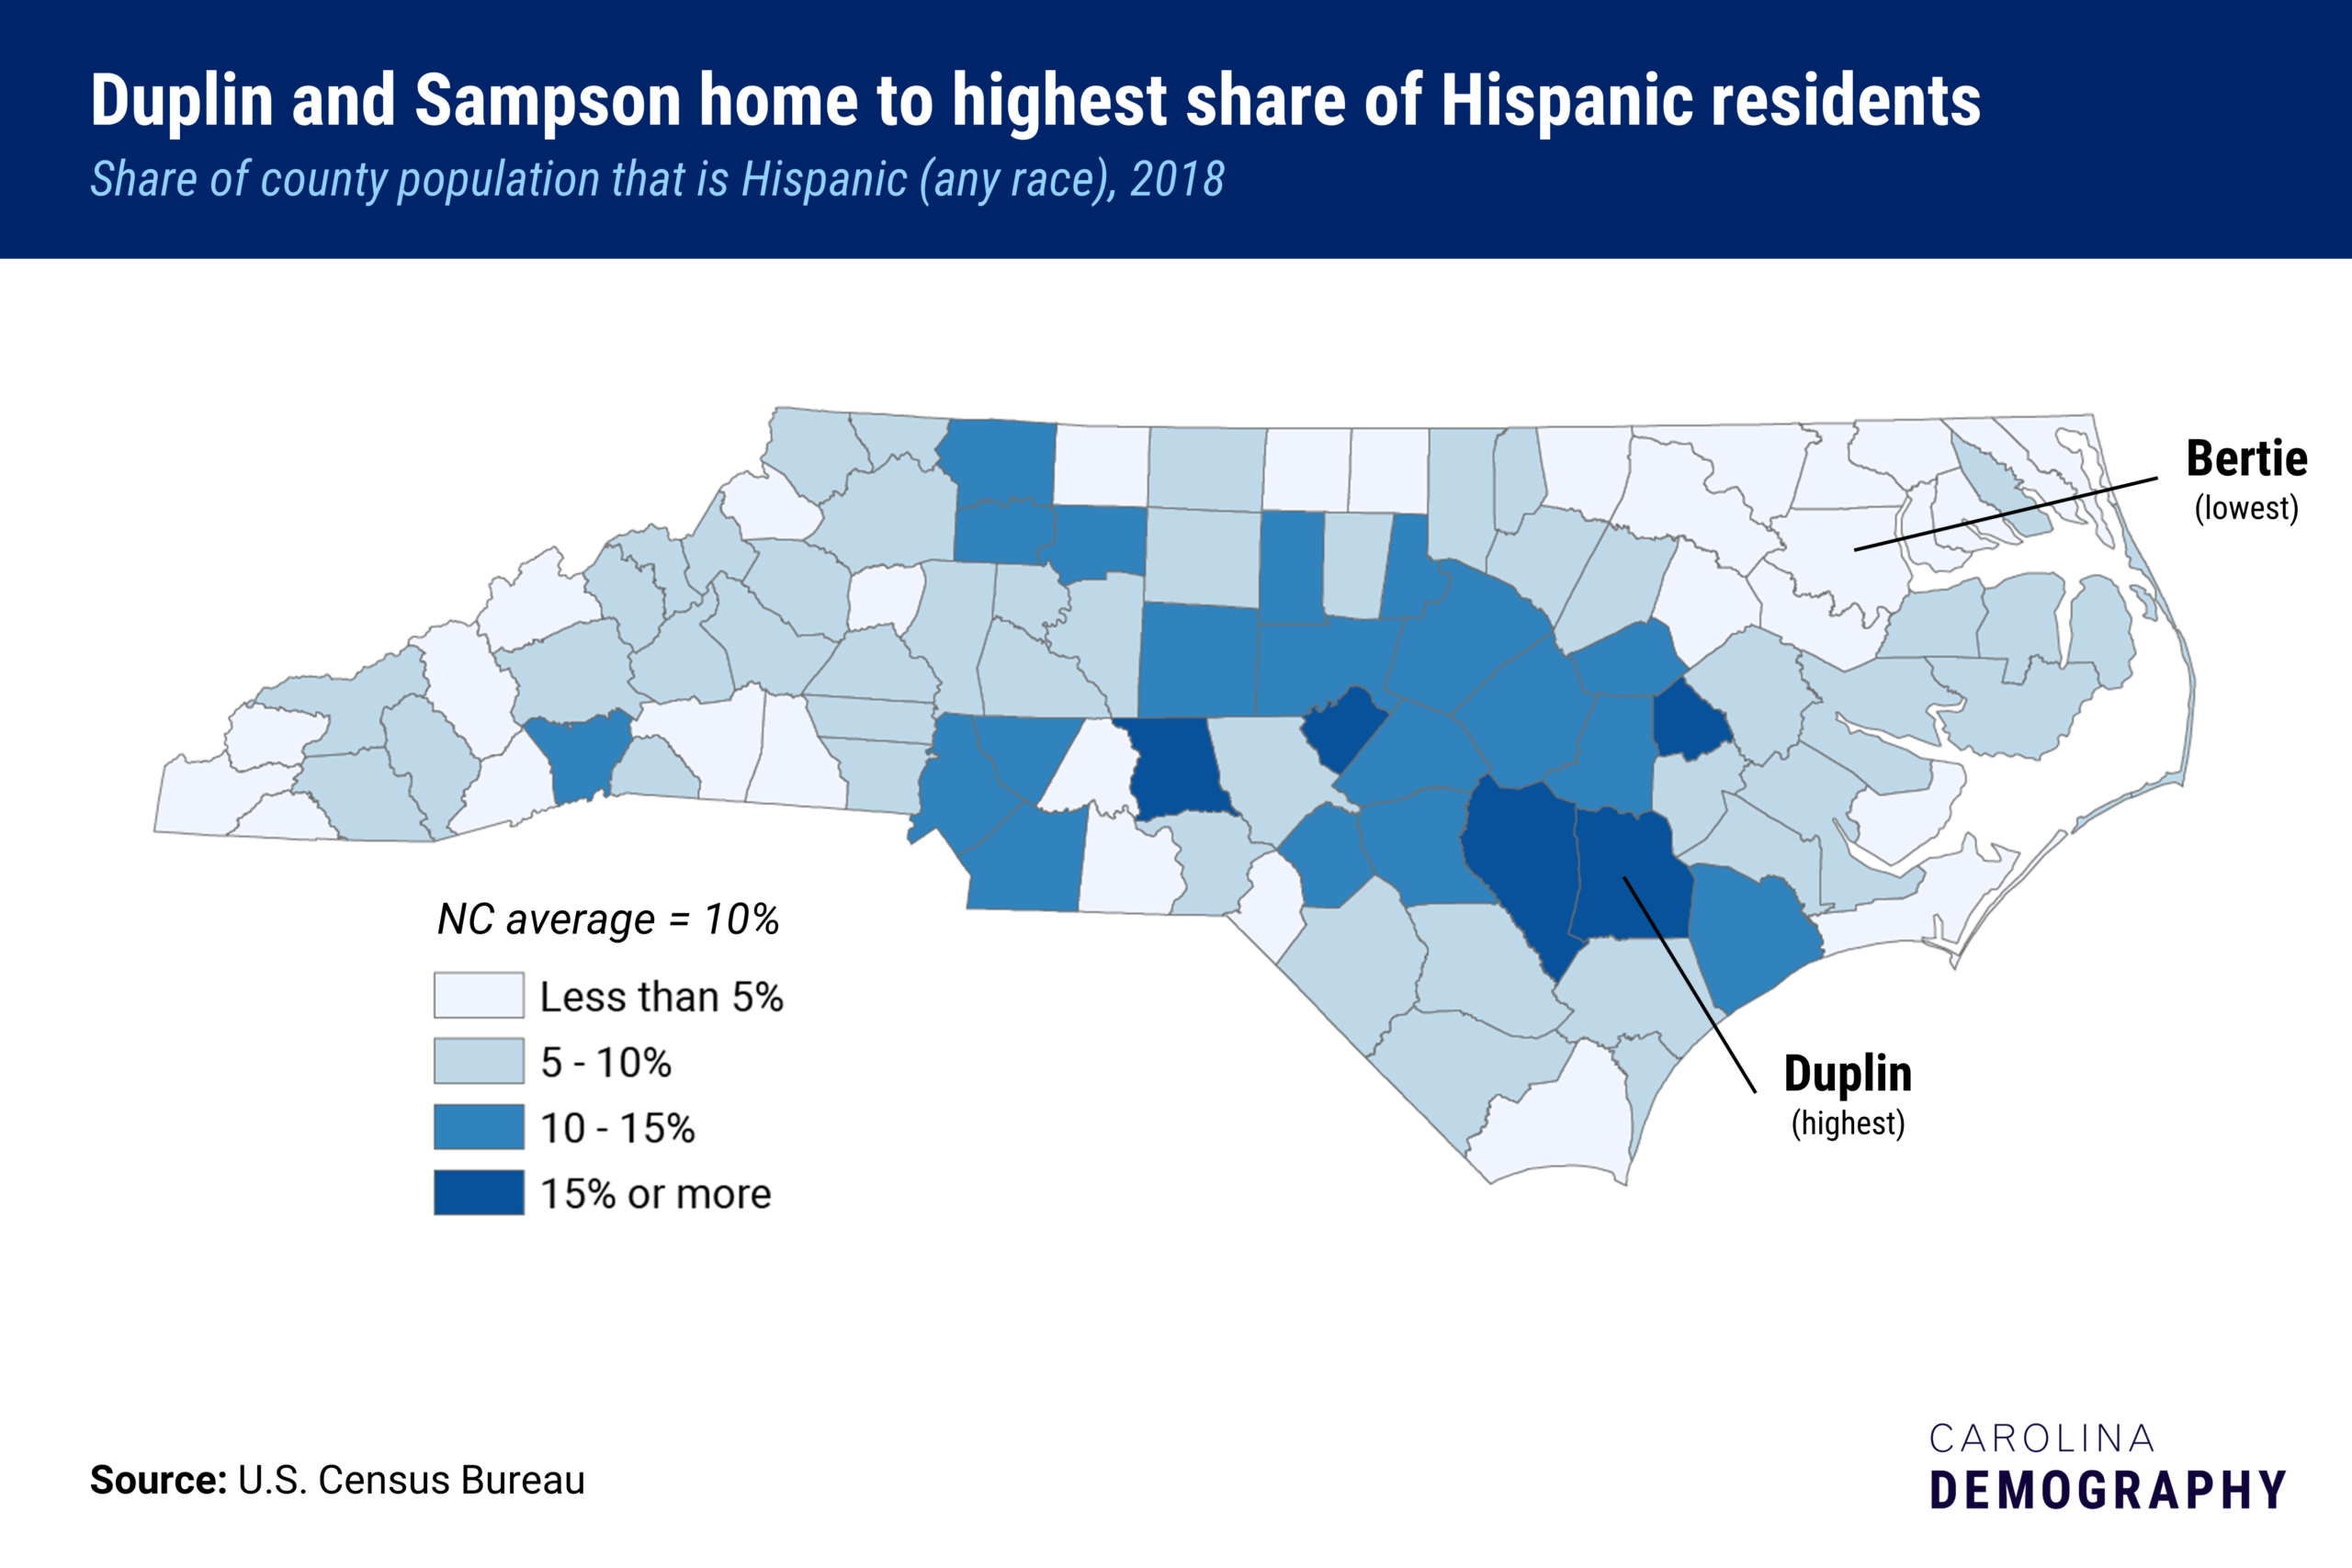
Mecklenburg had the largest Hispanic population of any North Carolina county on July 1, 2018 (148,351) and the largest numeric increase of the Hispanic population since July 1, 2017 (5,398). Duplin had the highest percentage of Hispanics at 23%.
Gates had the smallest Hispanic population (263) in 2018. Bertie had the lowest share of Hispanics (2%).
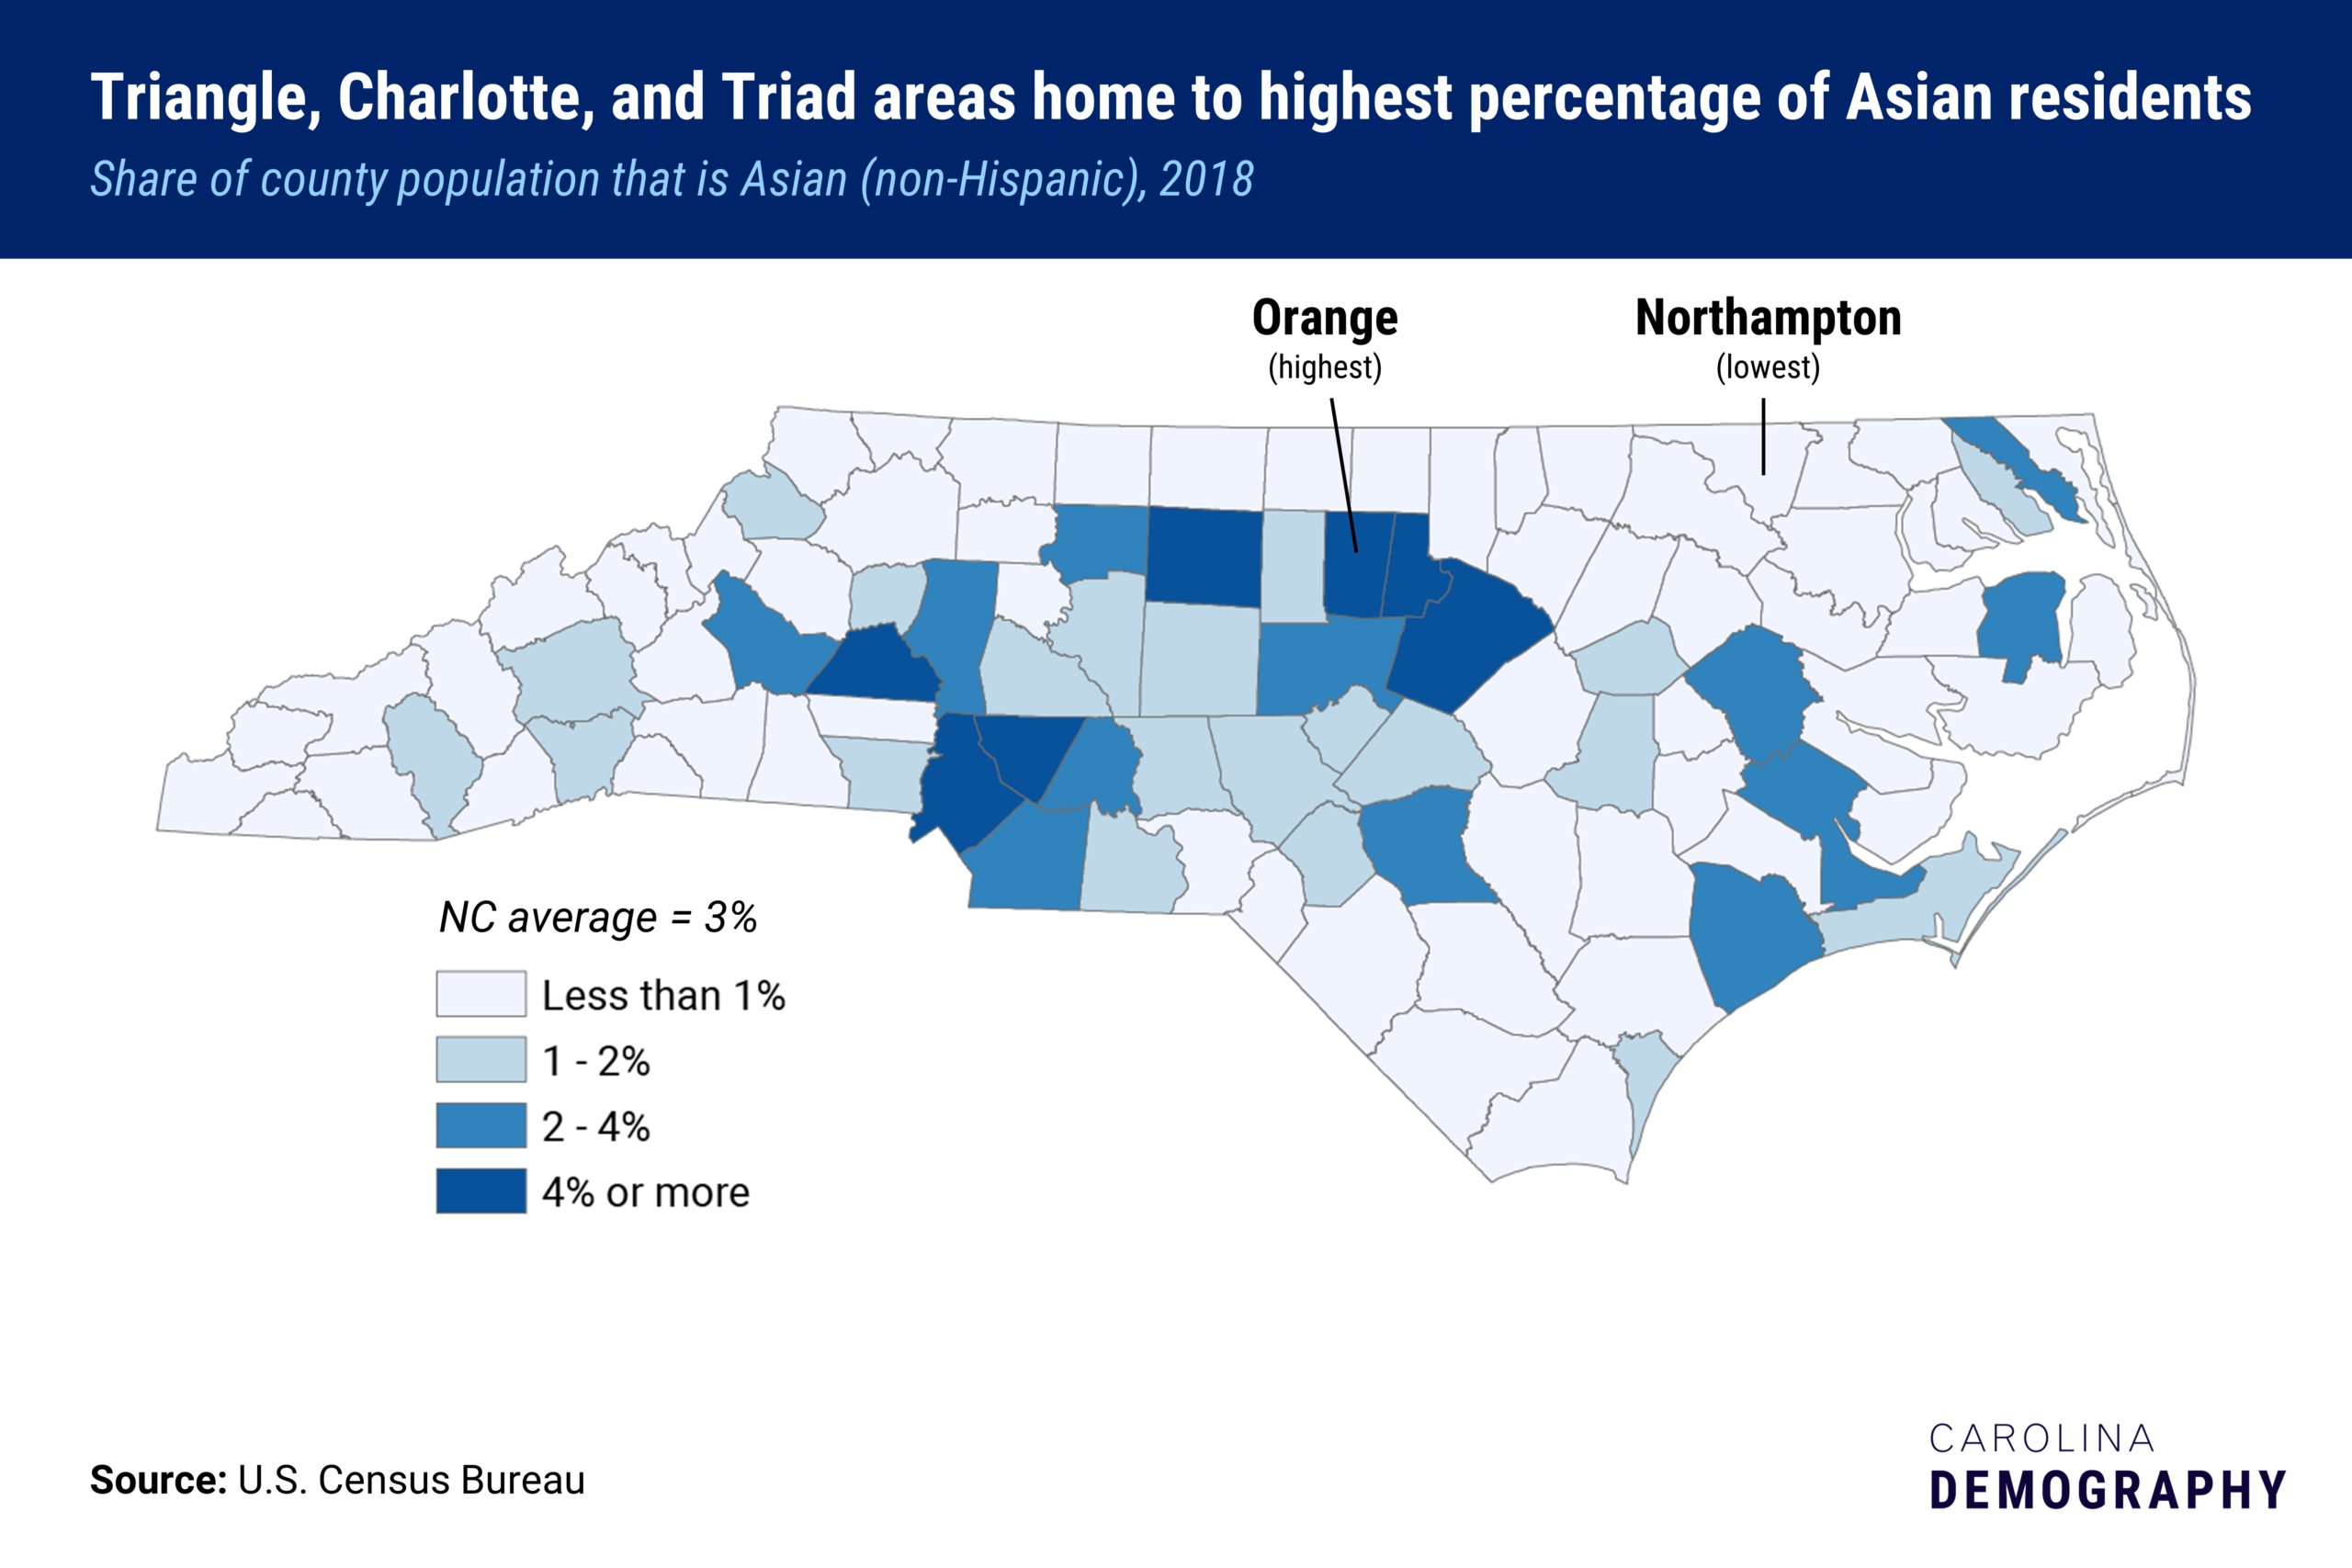
Wake had both the largest Asian and Pacific Islander population (81,733) in 2018 and the largest numeric increase since 2017 (4,566). Orange had the highest percentage of Asians, 8.2%.
Hyde had the smallest Asian population (40) in 2018. Fifteen additional counties had fewer than 100 Asian residents in 2018. Northampton had the smallest percentage of Asians (0.2%) in the state.
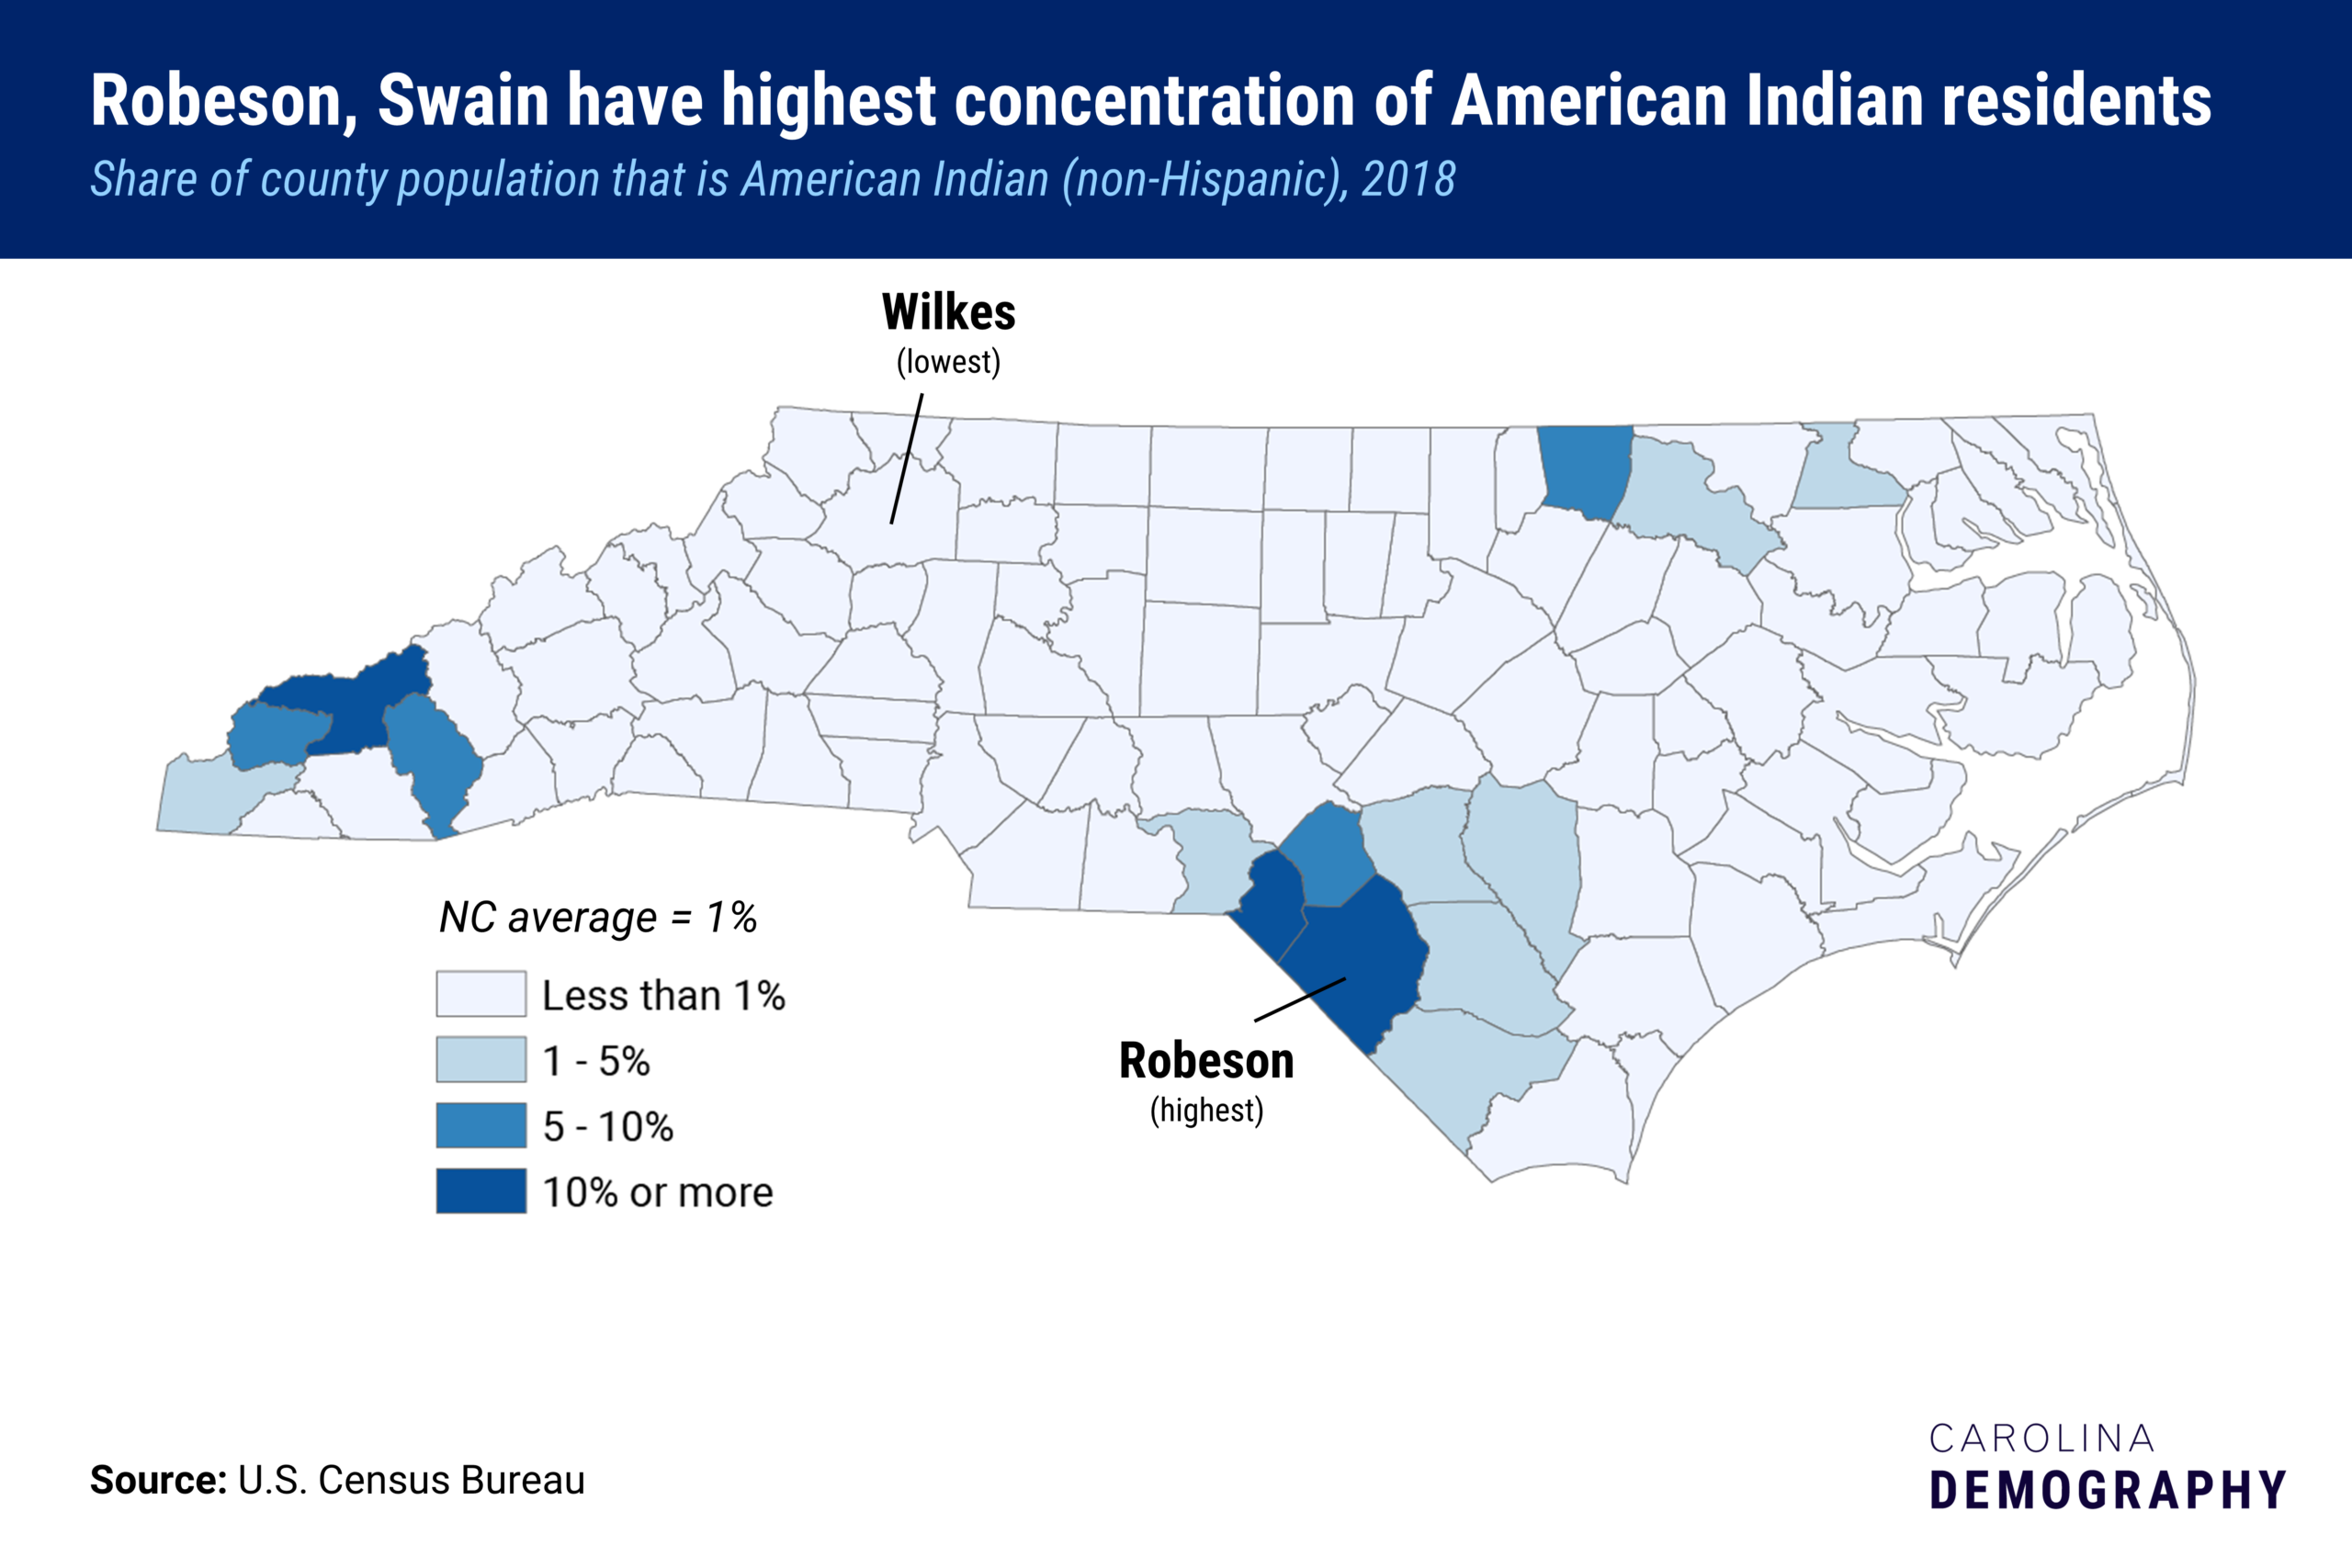
Robeson had the largest population of American Indian and Alaska Natives (52,413) in July 2018, more than ten times larger than the second largest population in Cumberland (4,870). Wake had the largest numeric increase since 2017 (66). Robeson had the highest percentage of American Indian residents (40%), followed by Swain (27%).
Tyrrell had the smallest American Indian and Alaska Native population (11) in 2018. Twenty other counties had fewer than 100 American Indian/Alaska Native residents in 2018. Wilkes had the smallest percentage of American Indians (0.2%) in the state.
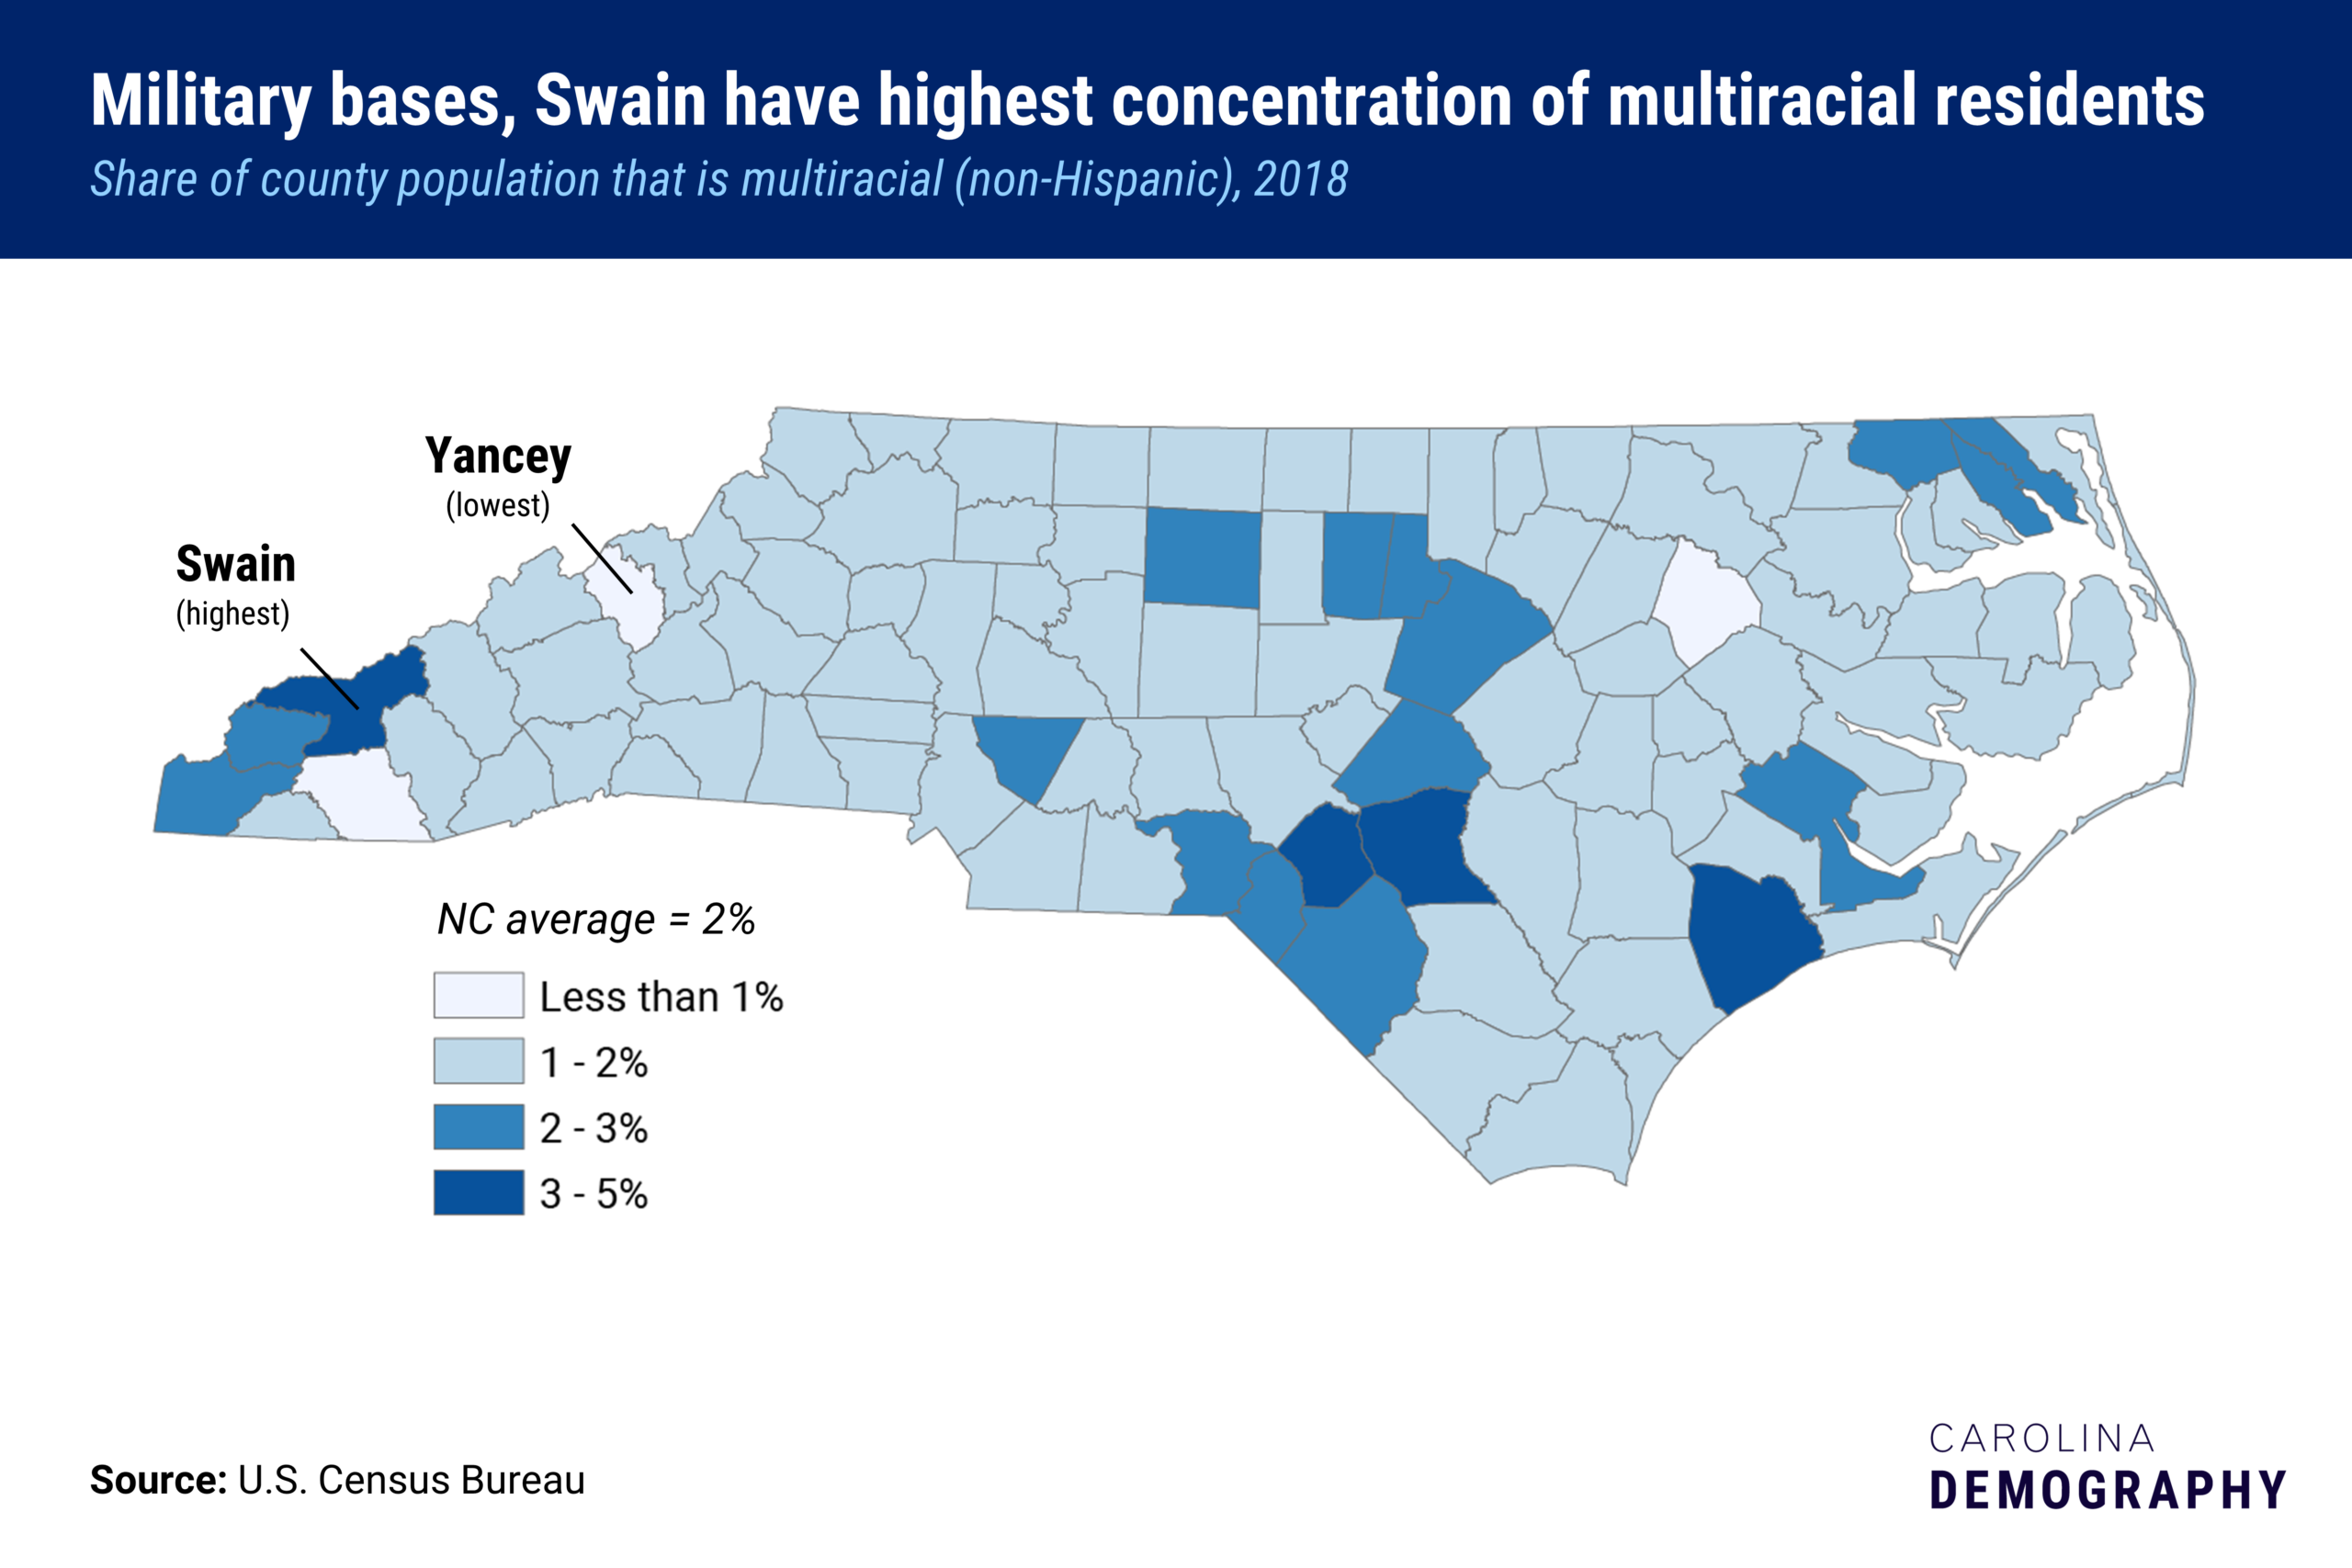
Wake had the largest population of multiracial individuals (23,095) in July 2018 and the largest numeric increase since 2017 (843). Swain had the highest percentage of multiracial residents (4.4%). Other counties with high proportions of multiracial residents were notably in communities with a strong military presence: Onslow (Camp Lejeune) and Cumberland and Hoke (Fort Bragg).
Hyde had the smallest multiracial population (68) in 2018. Yancey had the smallest percentage of multiracial residents (0.9%) in the state.
Want to know more about North Carolina’s population changes? Subscribe to the monthly Carolina Demography newsletter.
Need help understanding population change and its impacts on your community or business? Carolina Demography offers demographic research tailored to your needs.
Contact us today for a free initial consultation.
Contact UsCategories: NC in Focus

The Center for Women’s Health Research (CWHR) at the University of North Carolina School of Medicine released the 12th edition of our North Carolina Women’s Health Report Card on May 9, 2022. This document is a progress report on the…

Dr. Krista Perreira is a health economist who studies disparities in health, education, and economic well-being. In collaboration with the Urban Institute, she recently co-led a study funded by the Kate B. Reynolds Foundation to study barriers to access to…

Our material helped the NC Local News Lab Fund better understand and then prioritize their funding to better serve existing and future grant recipients in North Carolina. The North Carolina Local News Lab Fund was established in 2017 to strengthen…
Your support is critical to our mission of measuring, understanding, and predicting population change and its impact. Donate to Carolina Demography today.