
Population can grow—or decline—from one of two components of change: net migration (both domestic and international) or natural growth (births and deaths). Though both components have contributed to North Carolina’s population growth, net migration has been the driving force of growth in North Carolina since 1990.
This has substantially changed the makeup of North Carolina’s population. More than 9 out of 10 North Carolina residents were native to the state a hundred years ago. By 2018, this percentage had changed dramatically. We reported that slightly under half of the state’s population was non-native – in other words, they were born somewhere other than North Carolina.
However, whether your neighbors are more likely to have been born in North Carolina also depends on where in North Carolina you live. In Edgecombe County, fewer than one in five residents are non-native, while in Currituck County, three-fourths of the residents were not born in NC.
This local variation raises another question: How does North Carolina’s native-born population compare to the native-born population of other states across the nation? In other words, in which states are you least likely to meet someone who was born in that state? And where in the United States is it more common to find a native-born resident?
As of 2018, there were 10.4 million people living in North Carolina and 44% were born somewhere else. This puts us almost squarely in the middle of the 50 states. With a rank of 22 out of 50, it turns out that we don’t have a remarkably large or small non-native population statewide.
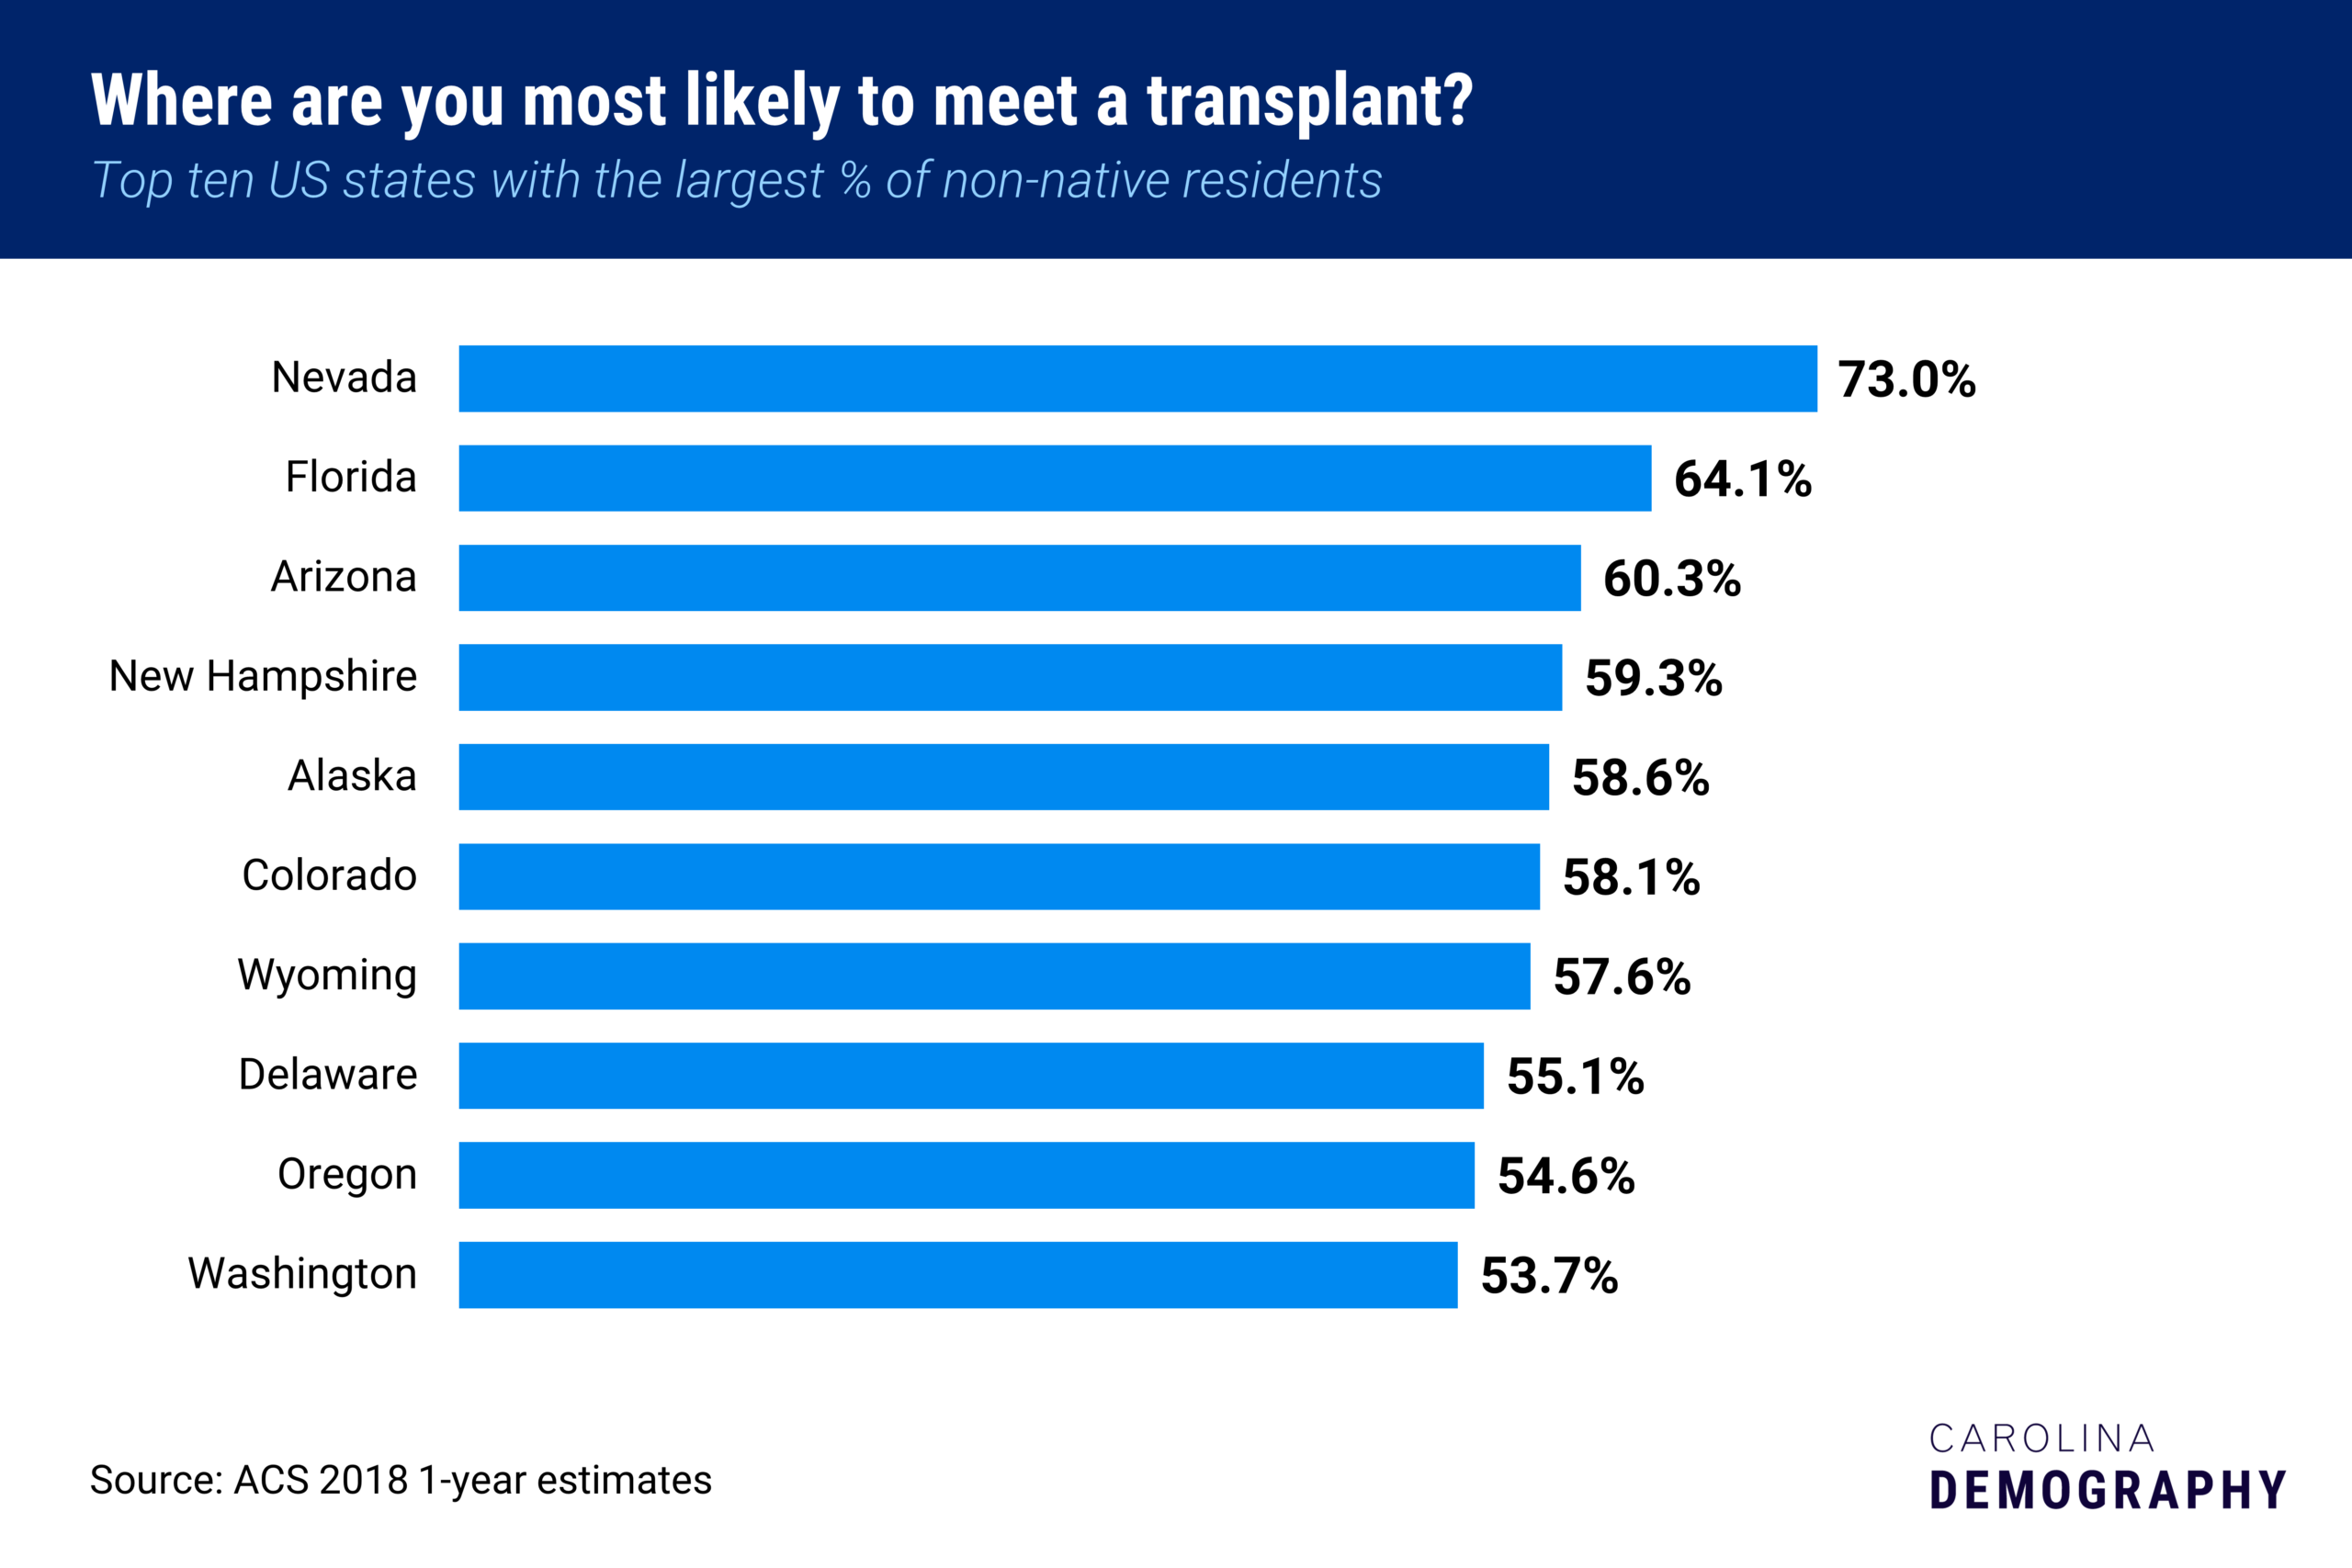
While states with large transplant populations may differ widely, many of them tend to feature a unique tourist destination and/or an economic incentive for new migrants.
The top three states with the largest non-native populations – Nevada, Florida, and Arizona – are located along the Sunbelt. These are prime destinations for snowbirds and retirees. Among the top ten states for transplants, half have no state income tax: Nevada, Florida, Alaska, Wyoming, and Washington. New Hampshire, similarly, has no tax on earned income.
Unlike the geographic diversity of the states with the largest non-native populations, the states with the smallest non-native populations were more geographically clustered: all of them are in the Southeast and Midwest. In the states with the smallest non-native populations—Louisiana, Michigan, and Ohio—you are roughly three times (or more) as likely to meet a native than a non-native.
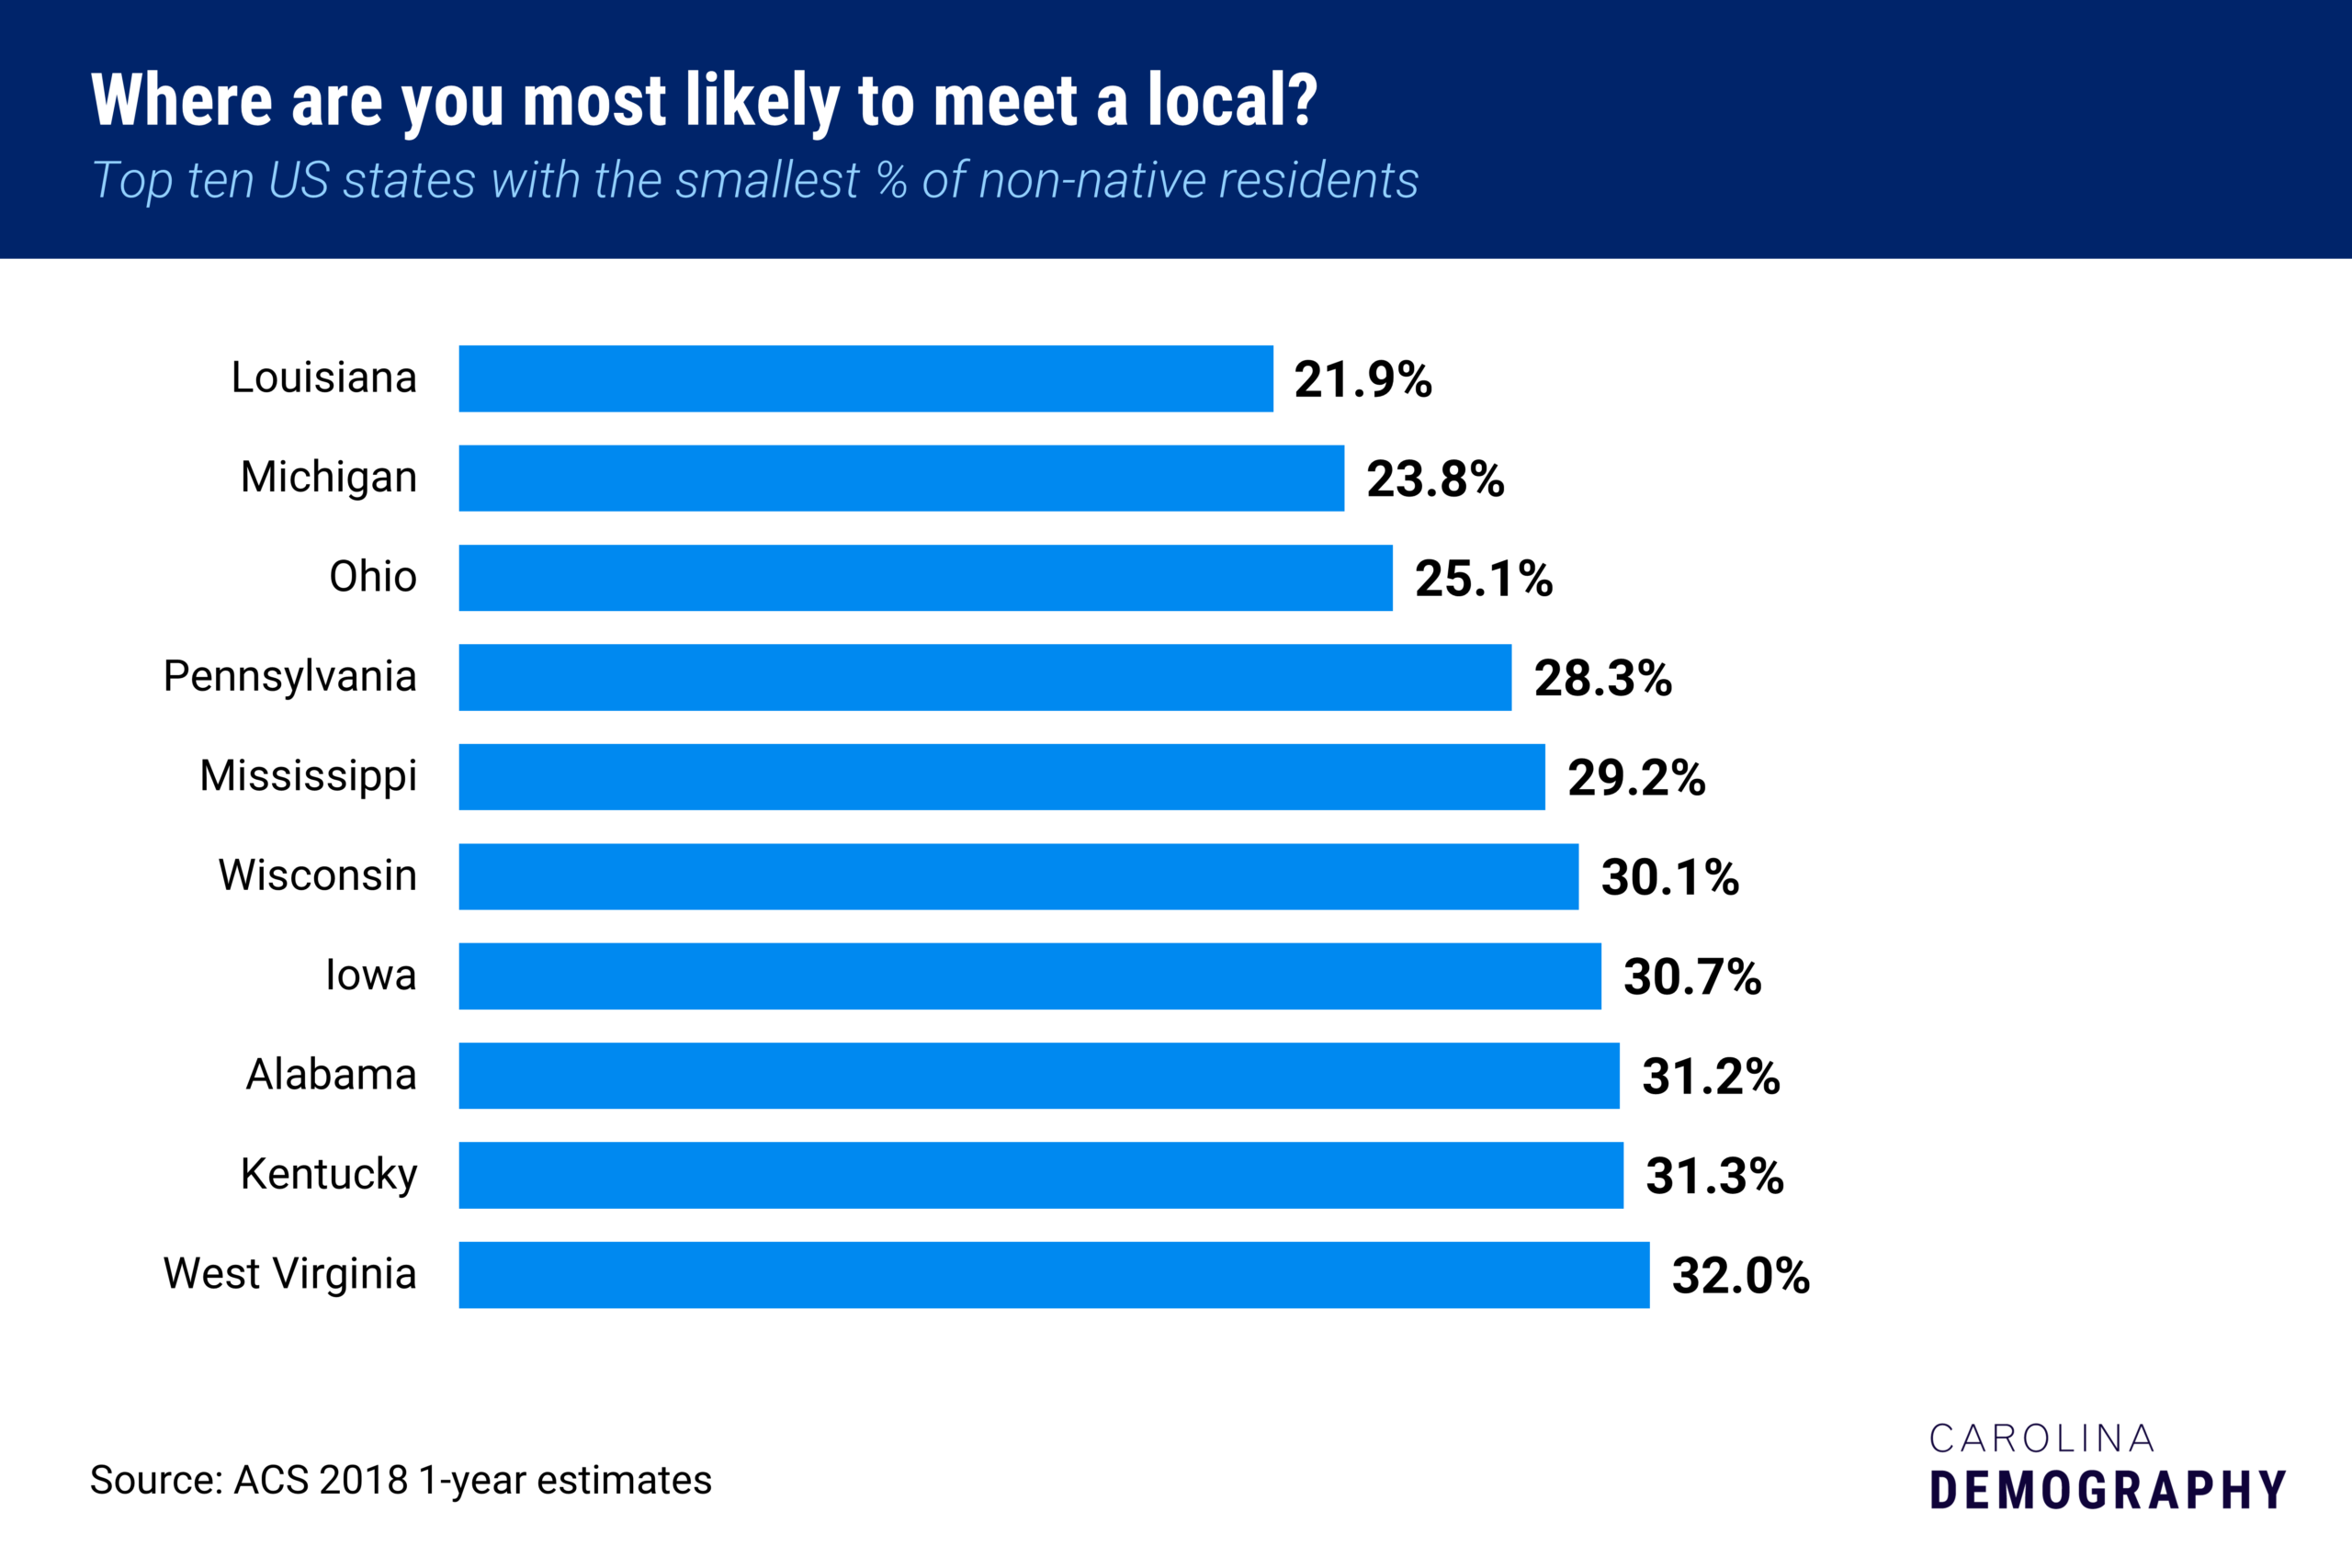
These states tend to receive fewer in-migrants than those above, which in large part accounts for the greater share of native residents.
However, native residents who chose to stay or return to their place of birth may have done so for personal reasons. States with larger native populations may foster a deeper sense of shared history or values, compared to states where fewer people grew up there.
Note: These estimates came from Table B05002: Place of Birth by Nativity and Citizenship Status in the American Community Survey 2018 1-year estimates. For this analysis, the District of Columbia was excluded.
Need help understanding population change and its impacts on your community or business? Carolina Demography offers demographic research tailored to your needs.
Contact us today for a free initial consultation.
Contact UsCategories: Migration, NC in Focus

The Center for Women’s Health Research (CWHR) at the University of North Carolina School of Medicine released the 12th edition of our North Carolina Women’s Health Report Card on May 9, 2022. This document is a progress report on the…

Dr. Krista Perreira is a health economist who studies disparities in health, education, and economic well-being. In collaboration with the Urban Institute, she recently co-led a study funded by the Kate B. Reynolds Foundation to study barriers to access to…

Our material helped the NC Local News Lab Fund better understand and then prioritize their funding to better serve existing and future grant recipients in North Carolina. The North Carolina Local News Lab Fund was established in 2017 to strengthen…
Your support is critical to our mission of measuring, understanding, and predicting population change and its impact. Donate to Carolina Demography today.