1. Are historically undercounted groups becoming more concentrated in low-responding Census tracts?
2. Which communities in North Carolina are currently in the bottom quintile of Census response rates?
3. How is COVID-19 affecting response rates?
Every household that doesn’t fill out the census form online, by mail, or by phone—known as “self-response”—enters the Census Bureau’s non-response follow-up (NRFU) universe. During NRFU, the Census Bureau sends trained enumerators door-to-door to collect census responses directly. This is an expensive and time-consuming process. NRFU was supposed to start in May 2020 but has been delayed due to COVID-19.
The Census Bureau currently plans to begin NRFU operations in mid-August. To understand which communities this might impact, we examined shifts in the tracts with the lowest self-response (bottom 20%) and compared low response rates on March 20th with the lowest responding tracts as of May 17th. (The bottom 20% is a fluid group. The tracts in the bottom can change week to week as certain communities increase their response rates.)
After identifying the bottom tracts, we used the 2018 5-Year American Community Survey data to understand who lives in these tracts, with an eye to answering: are historically undercounted groups becoming more concentrated in the low-responding tracts?
There are 2,195 census tracts in North Carolina. Of these, 29 either have no residents or do not have population in households, meaning that we are not tracking them during the self-response phase. When we split the remaining 2,166 census tracts into 5 groups to understand the bottom 20%, this means that there should generally be about 433 census tracts in the bottom 20% (sometimes this number will fluctuate if multiple tracts have the same response rate.)
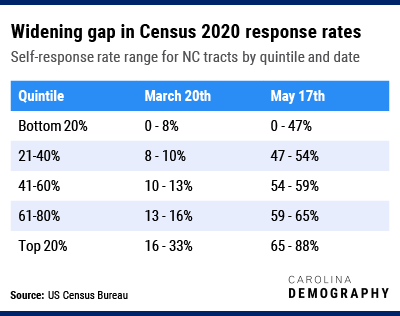
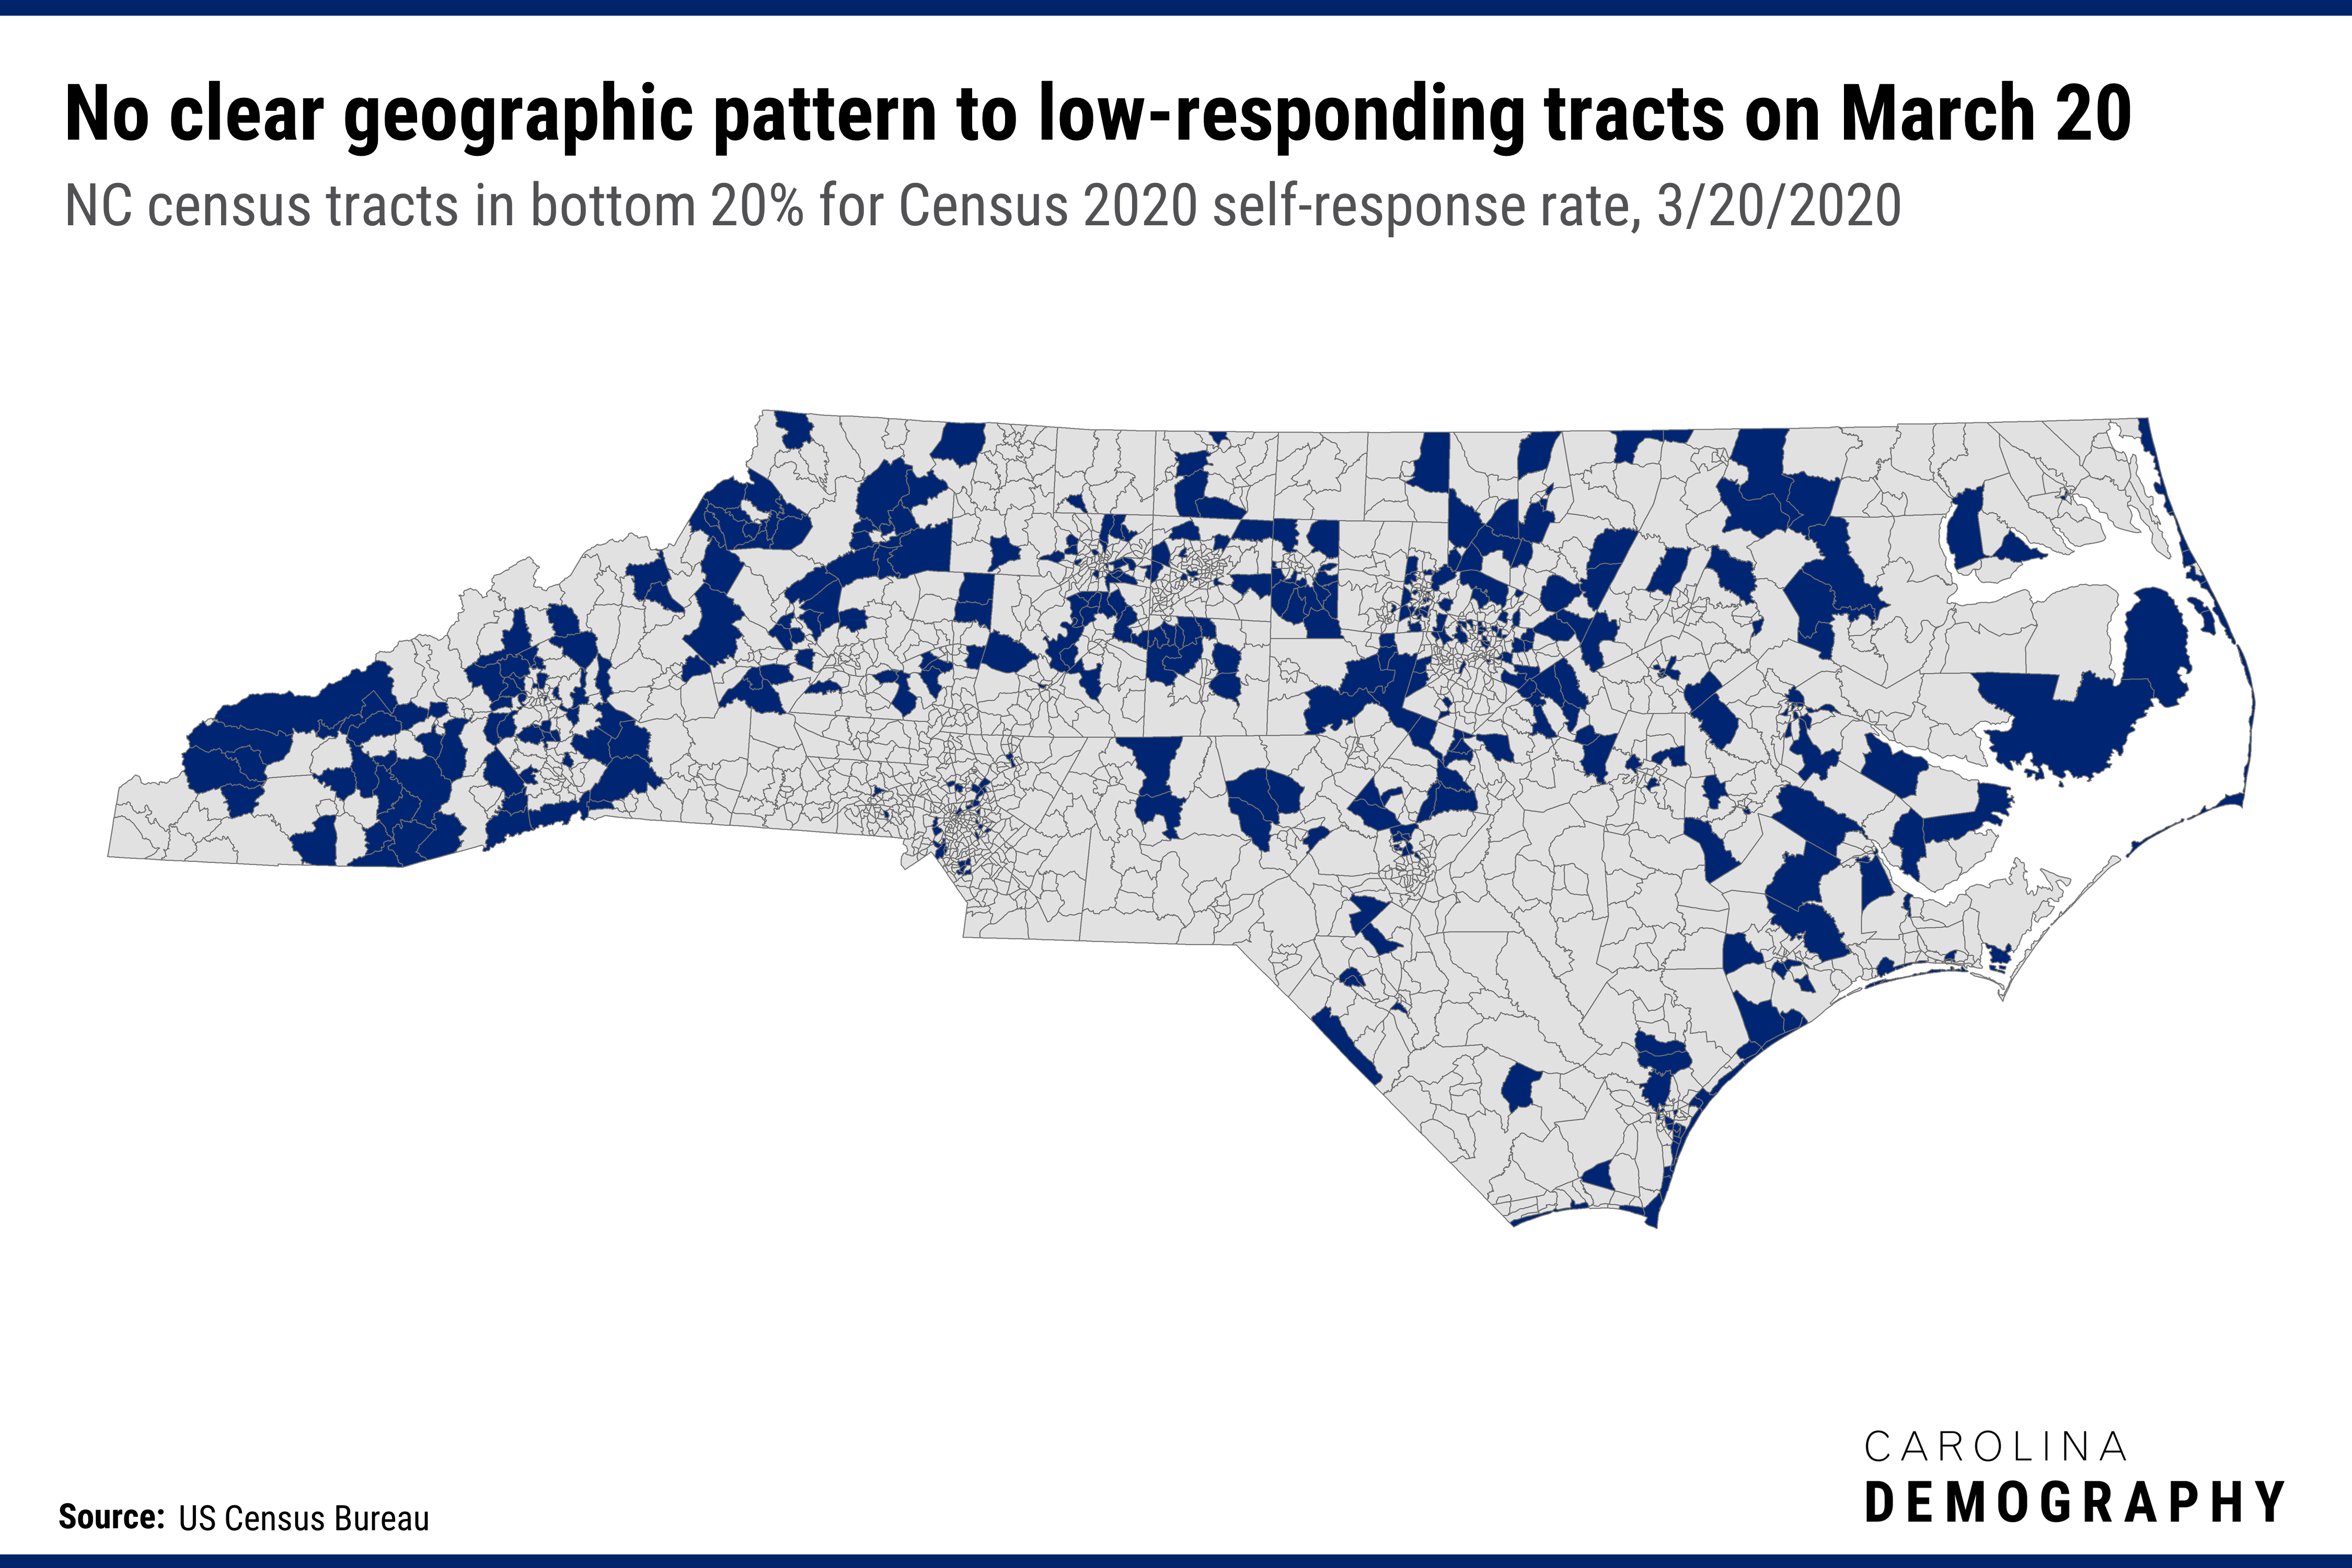
On March 20th, there were 436 census tracts in the bottom 20%. These tracts had a self-response rate less than 7.8% — 3.8 percentage points below the state average of 11.6%. Because this was early on, we don’t see much concentration: the bottom 20% of tracts in self-response had 19% of the population and 19% of housing units.
When we look at them on the map, there appears to be some concentration of low-responding tracts in the western part of the state, but there is no clear geographic pattern overall.
As of May 17th, the differences in response rates between the bottom 20% of tracts and the state have increased: less than 46.5% of households had responded to the census in the lowest-responding tracts, 9.2 percentage points below the state average of 55.7%. The tracts that are in the bottom 20% are now more rural, so they contain fewer residents and households overall: 16% of North Carolina’s population lived in one of the low-performing tracts as of May 17th.
There are also clear geographic patterns emerging: the lowest-responding tracts are heavily concentrated in western North Carolina, the Sandhills, and the northeast. These low-response patterns overlap with areas with low internet access and where field operations were suspended due to COVID-19.
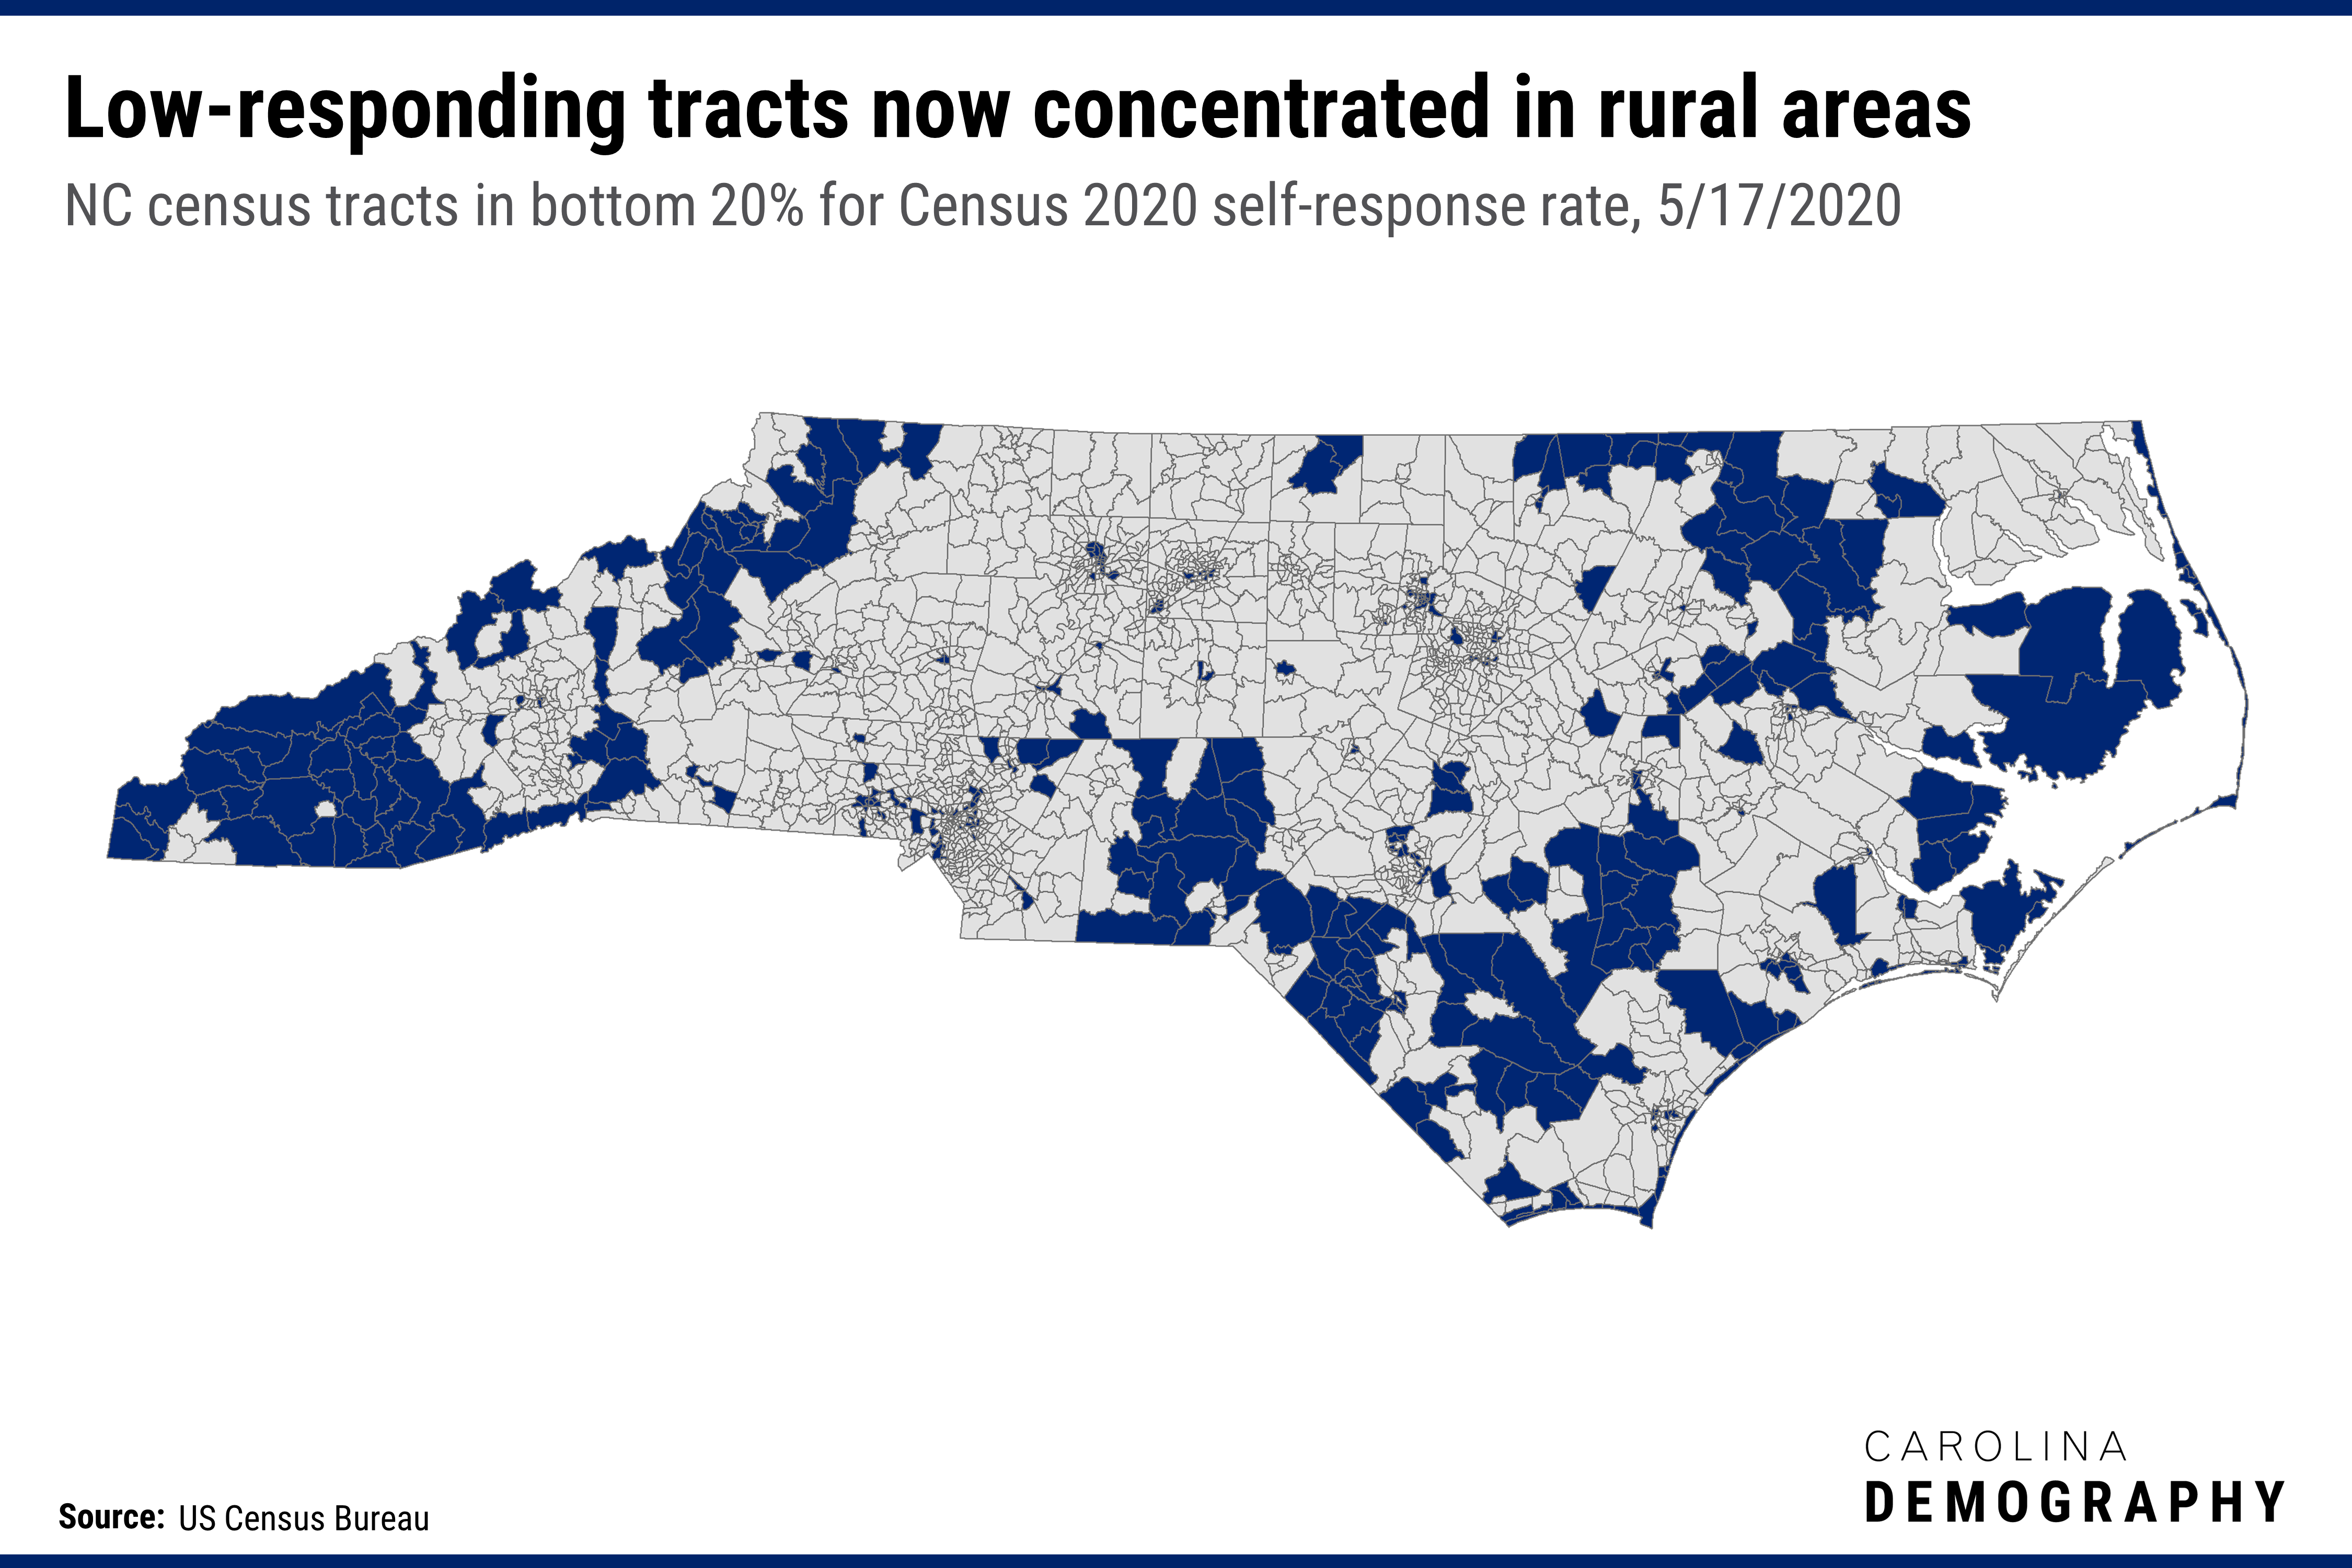
The total number of people living in the lowest-responding tracts as of May 17th was less than the total population living in these tracts on March 20th: 1.66 million, down nearly 300,000 or -19% from 1.96 million on March 20th. In other words, the tracts that are in the bottom 20% nearly two months into census reporting are more sparsely populated and rural than the tracts that were in the bottom 20% on March 20th.
This was not the case for all racial/ethnic groups. Examining the population in the lowest-performing tracts on March 20th and May 17th, the:
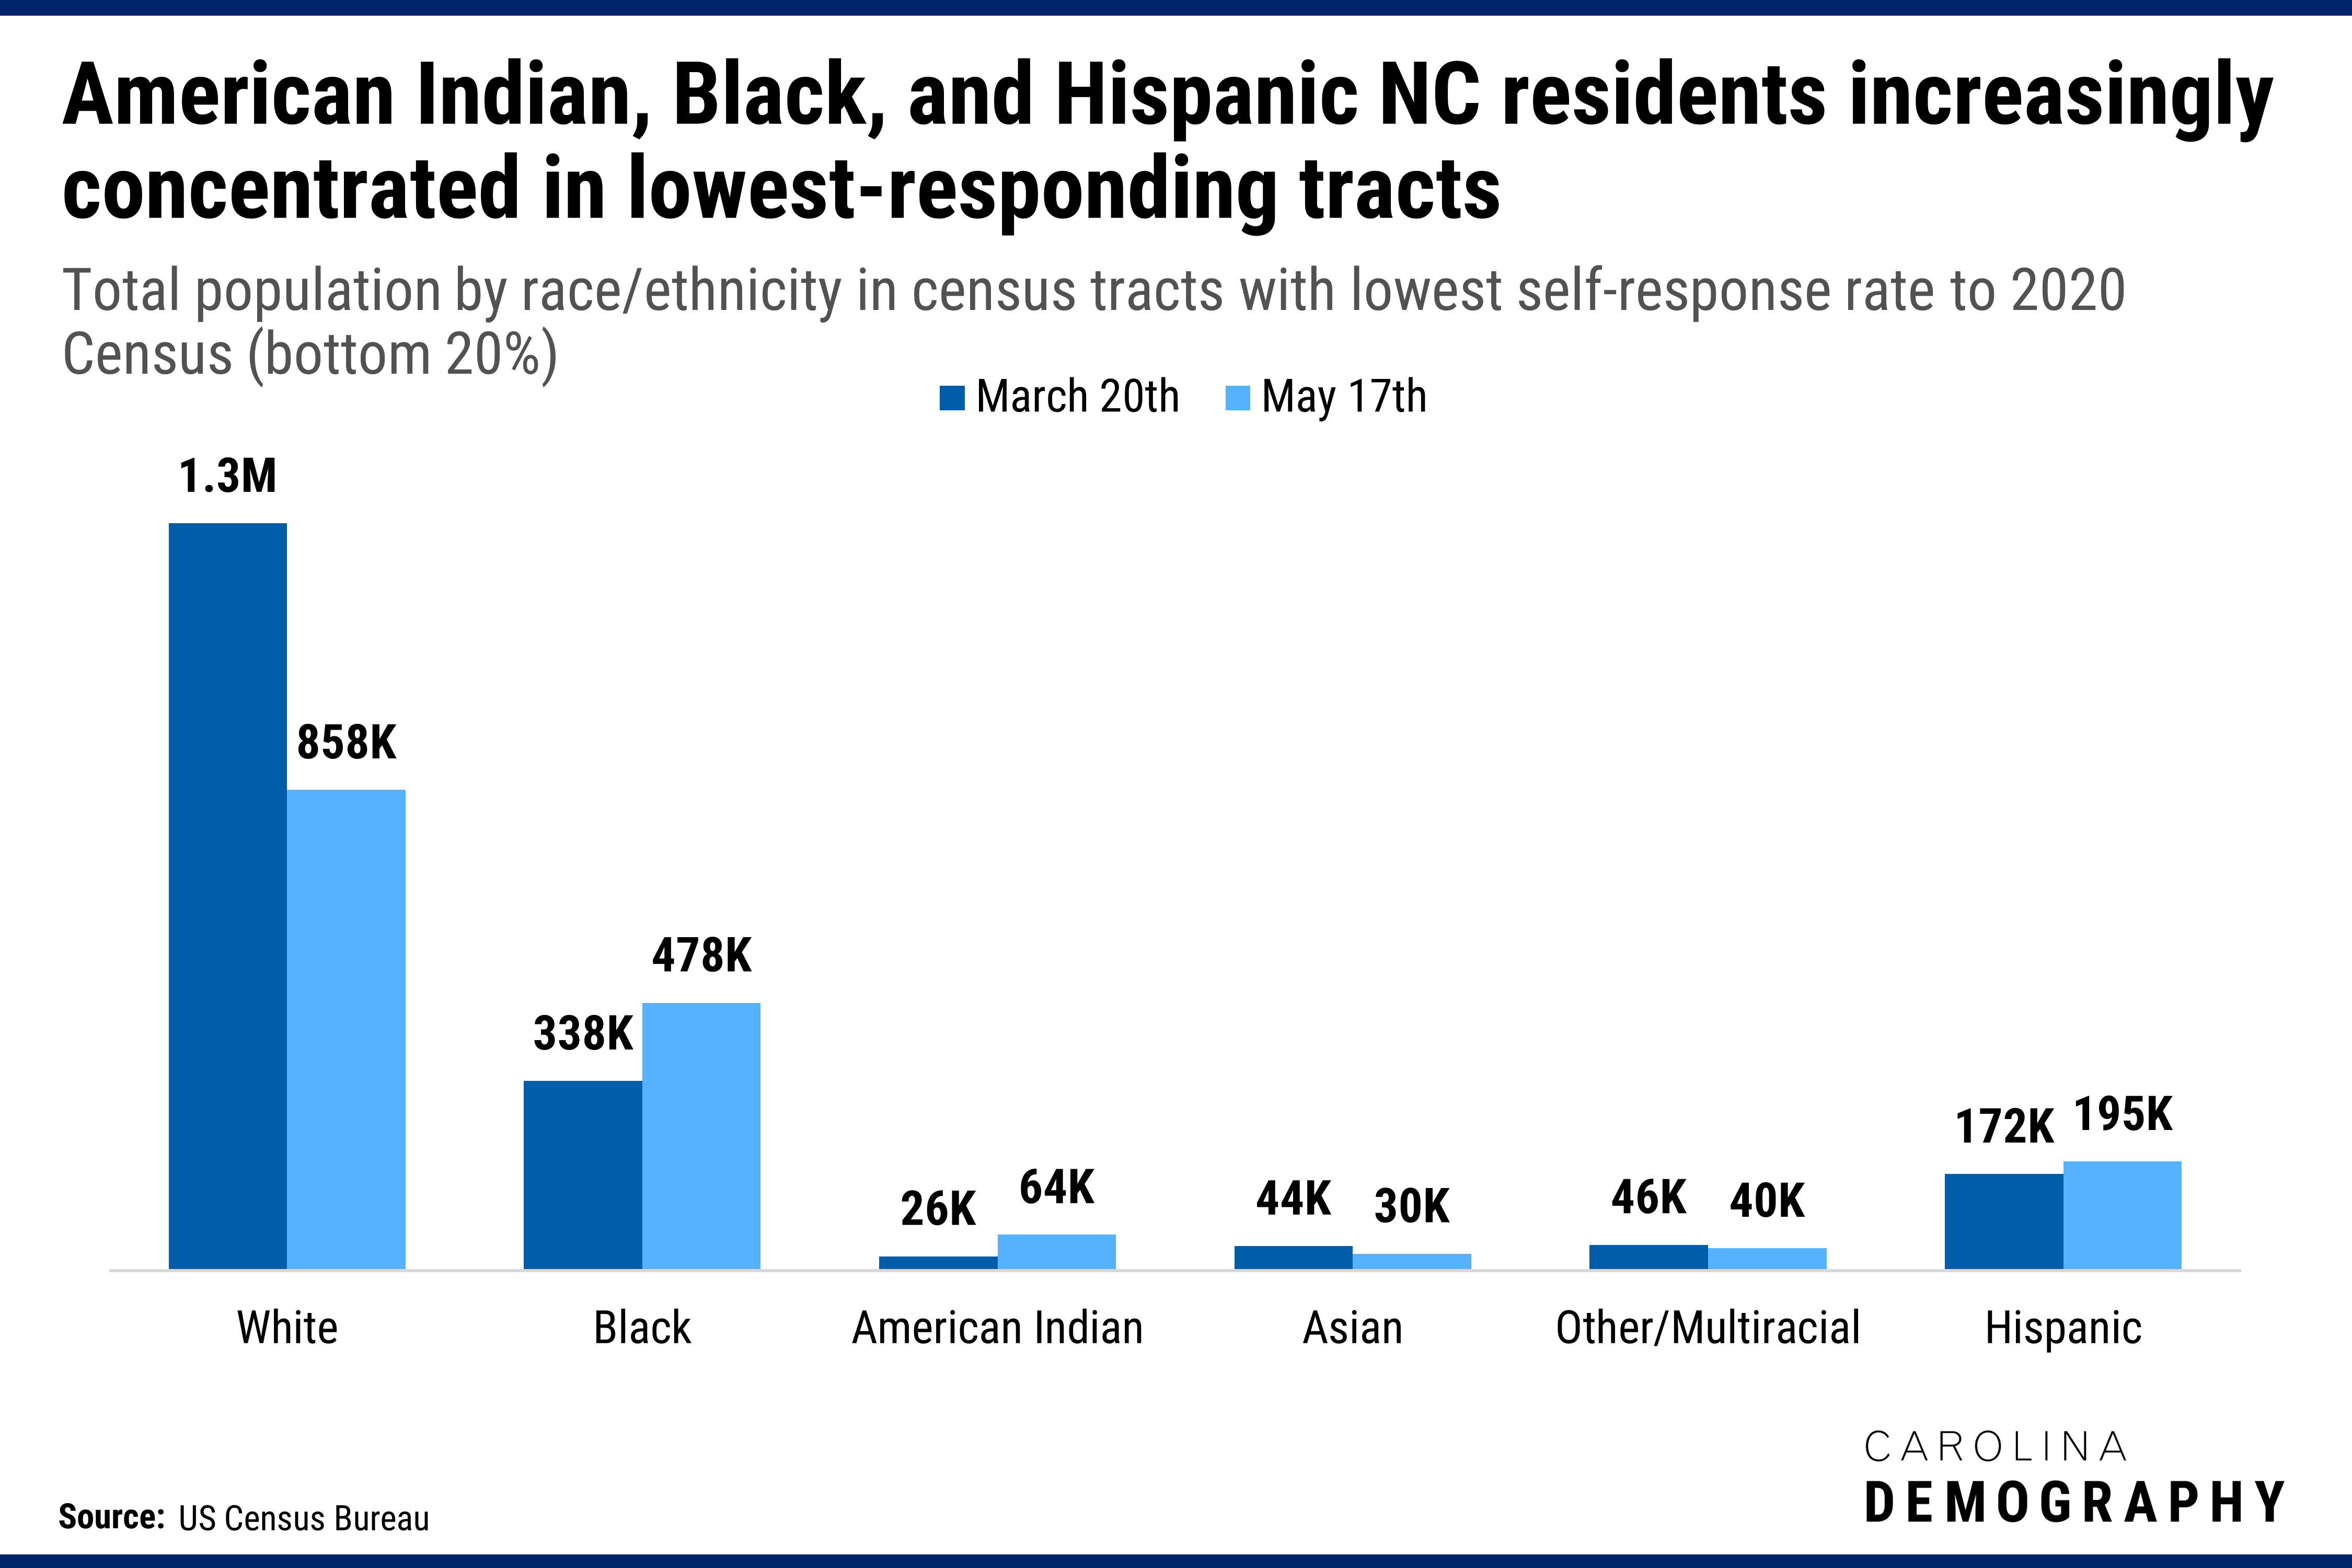
We are now seeing that the individuals living in the lowest-responding tracts are increasingly likely to be minority residents. On March 20th, just over one in four (27%) of residents in the lowest-responding tracts identified as American Indian, Black, or Hispanic/Latinx. As of May 17th, this proportion had increased to 44%.
Some of the communities in the lowest quintile for census self-response may increase their response rates now that North Carolina’s Area Census Offices restarted operations on May 11, 2020. Resumed activities include the Update Leave field operation, which impacts many households in the mountains, the coast, and the Sandhills regions of the state.
Increasing response rates across North Carolina is critical in the next few months. As the CUNY Graduate Center notes, “The NRFU door-knocking operation is challenging, expensive, and adds substantially to the risk that people will be missed or counted inaccurately.” When certain groups are more likely to be undercounted, their communities are at risk of having lower-quality data and less than their fair share of political representation and funding for the next decade.
Need help understanding population change and its impacts on your community or business? Carolina Demography offers demographic research tailored to your needs.
Contact us today for a free initial consultation.
Contact UsCategories: Carolina Demographics, Census 2020

The Center for Women’s Health Research (CWHR) at the University of North Carolina School of Medicine released the 12th edition of our North Carolina Women’s Health Report Card on May 9, 2022. This document is a progress report on the…

Dr. Krista Perreira is a health economist who studies disparities in health, education, and economic well-being. In collaboration with the Urban Institute, she recently co-led a study funded by the Kate B. Reynolds Foundation to study barriers to access to…

Our material helped the NC Local News Lab Fund better understand and then prioritize their funding to better serve existing and future grant recipients in North Carolina. The North Carolina Local News Lab Fund was established in 2017 to strengthen…
Your support is critical to our mission of measuring, understanding, and predicting population change and its impact. Donate to Carolina Demography today.