
This is part of our series looking at NC’s registered voters. Other stories include an overview of NC’s voters and an in-depth look at NC’s Republican voters.
As of July 25th, 2020, North Carolina had 7 million registered voters. Of these, 2.5 million or 36% were registered as a Democrat.
Older voters are the most likely to register as a Democrat, partly reflecting the legacy of the “Solid South.” Just over 43% of voters ages 75 and older are registered Democrats compared to 33% of 18-34 year-olds, 35% of 35-54 year-olds, and 39% of voters ages 55-74. As a result, older adults comprise a larger share of the state’s Democratic voters than the overall electorate.
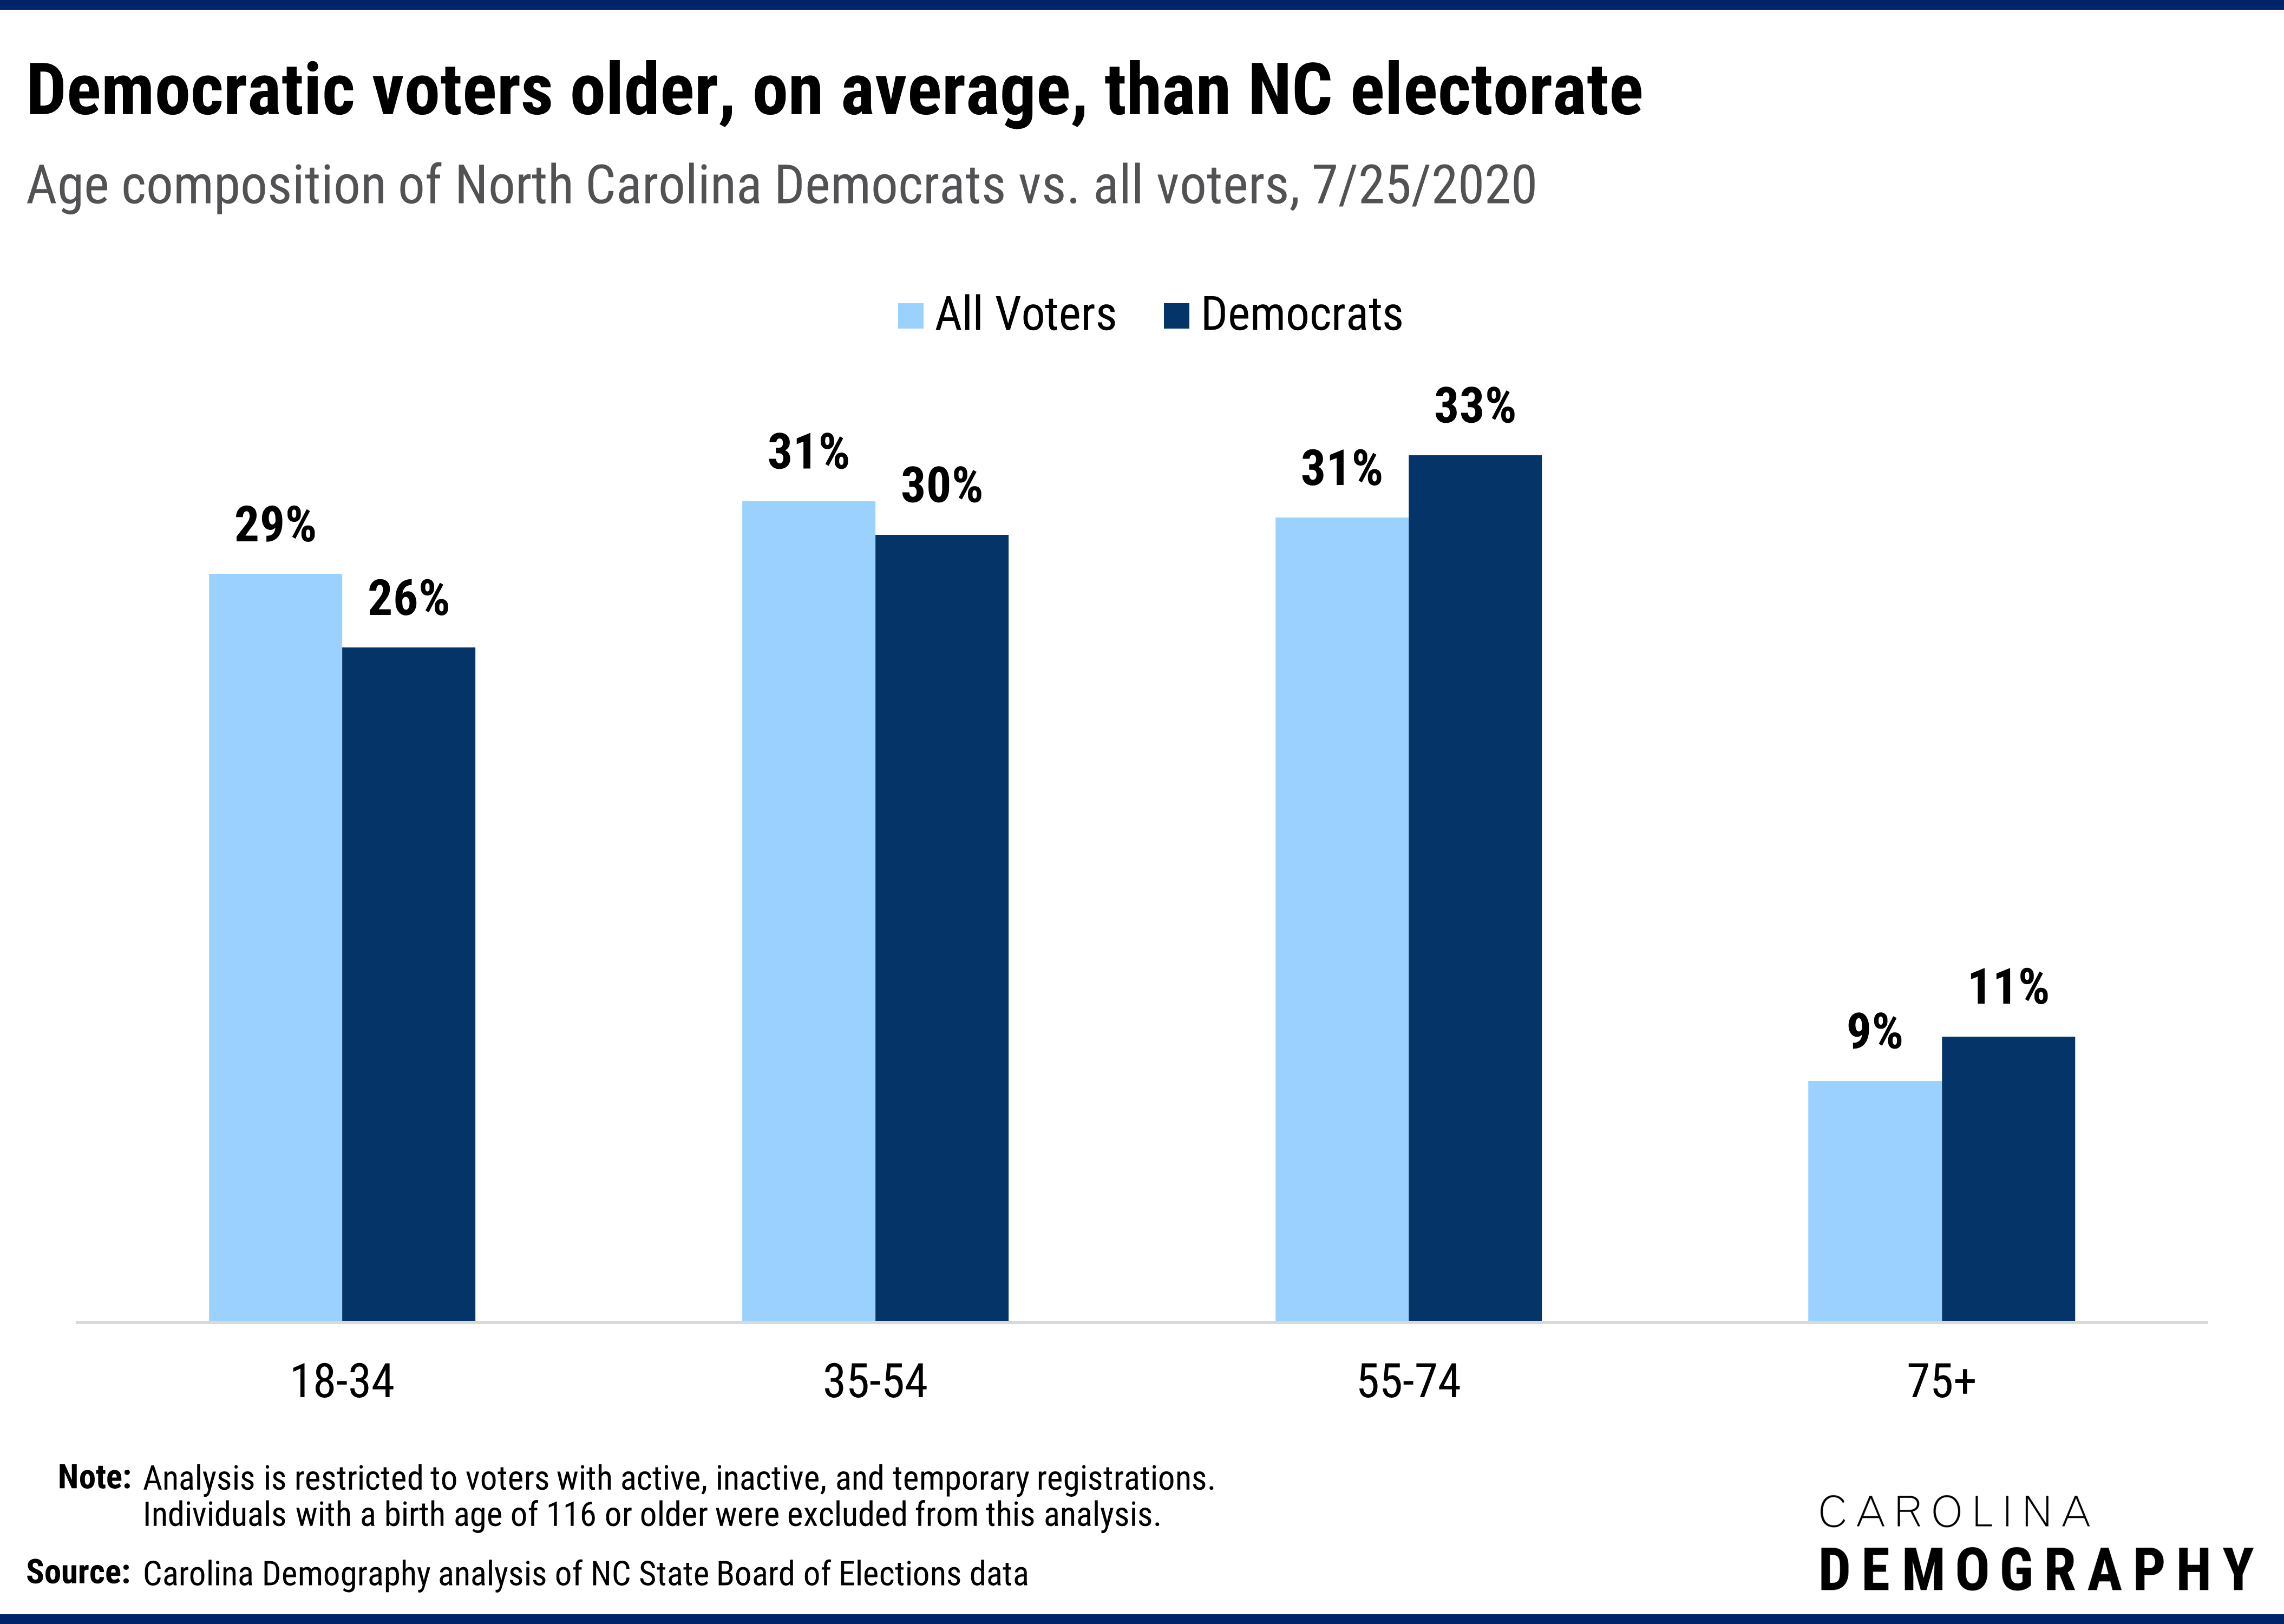
Reflecting this age structure, North Carolina’s registered Democrats have the highest proportion of voters registered in 1990 or earlier: 17.9% compared to 16.6% of Republicans and 6.4% of unaffiliated voters.
Democratic voters are more diverse than the statewide electorate. Black voters comprise the largest racial/ethnic group among Democratic voters: 46% versus 21% statewide. White voters are the second largest group among registered Democrats (41% vs. 65% statewide).
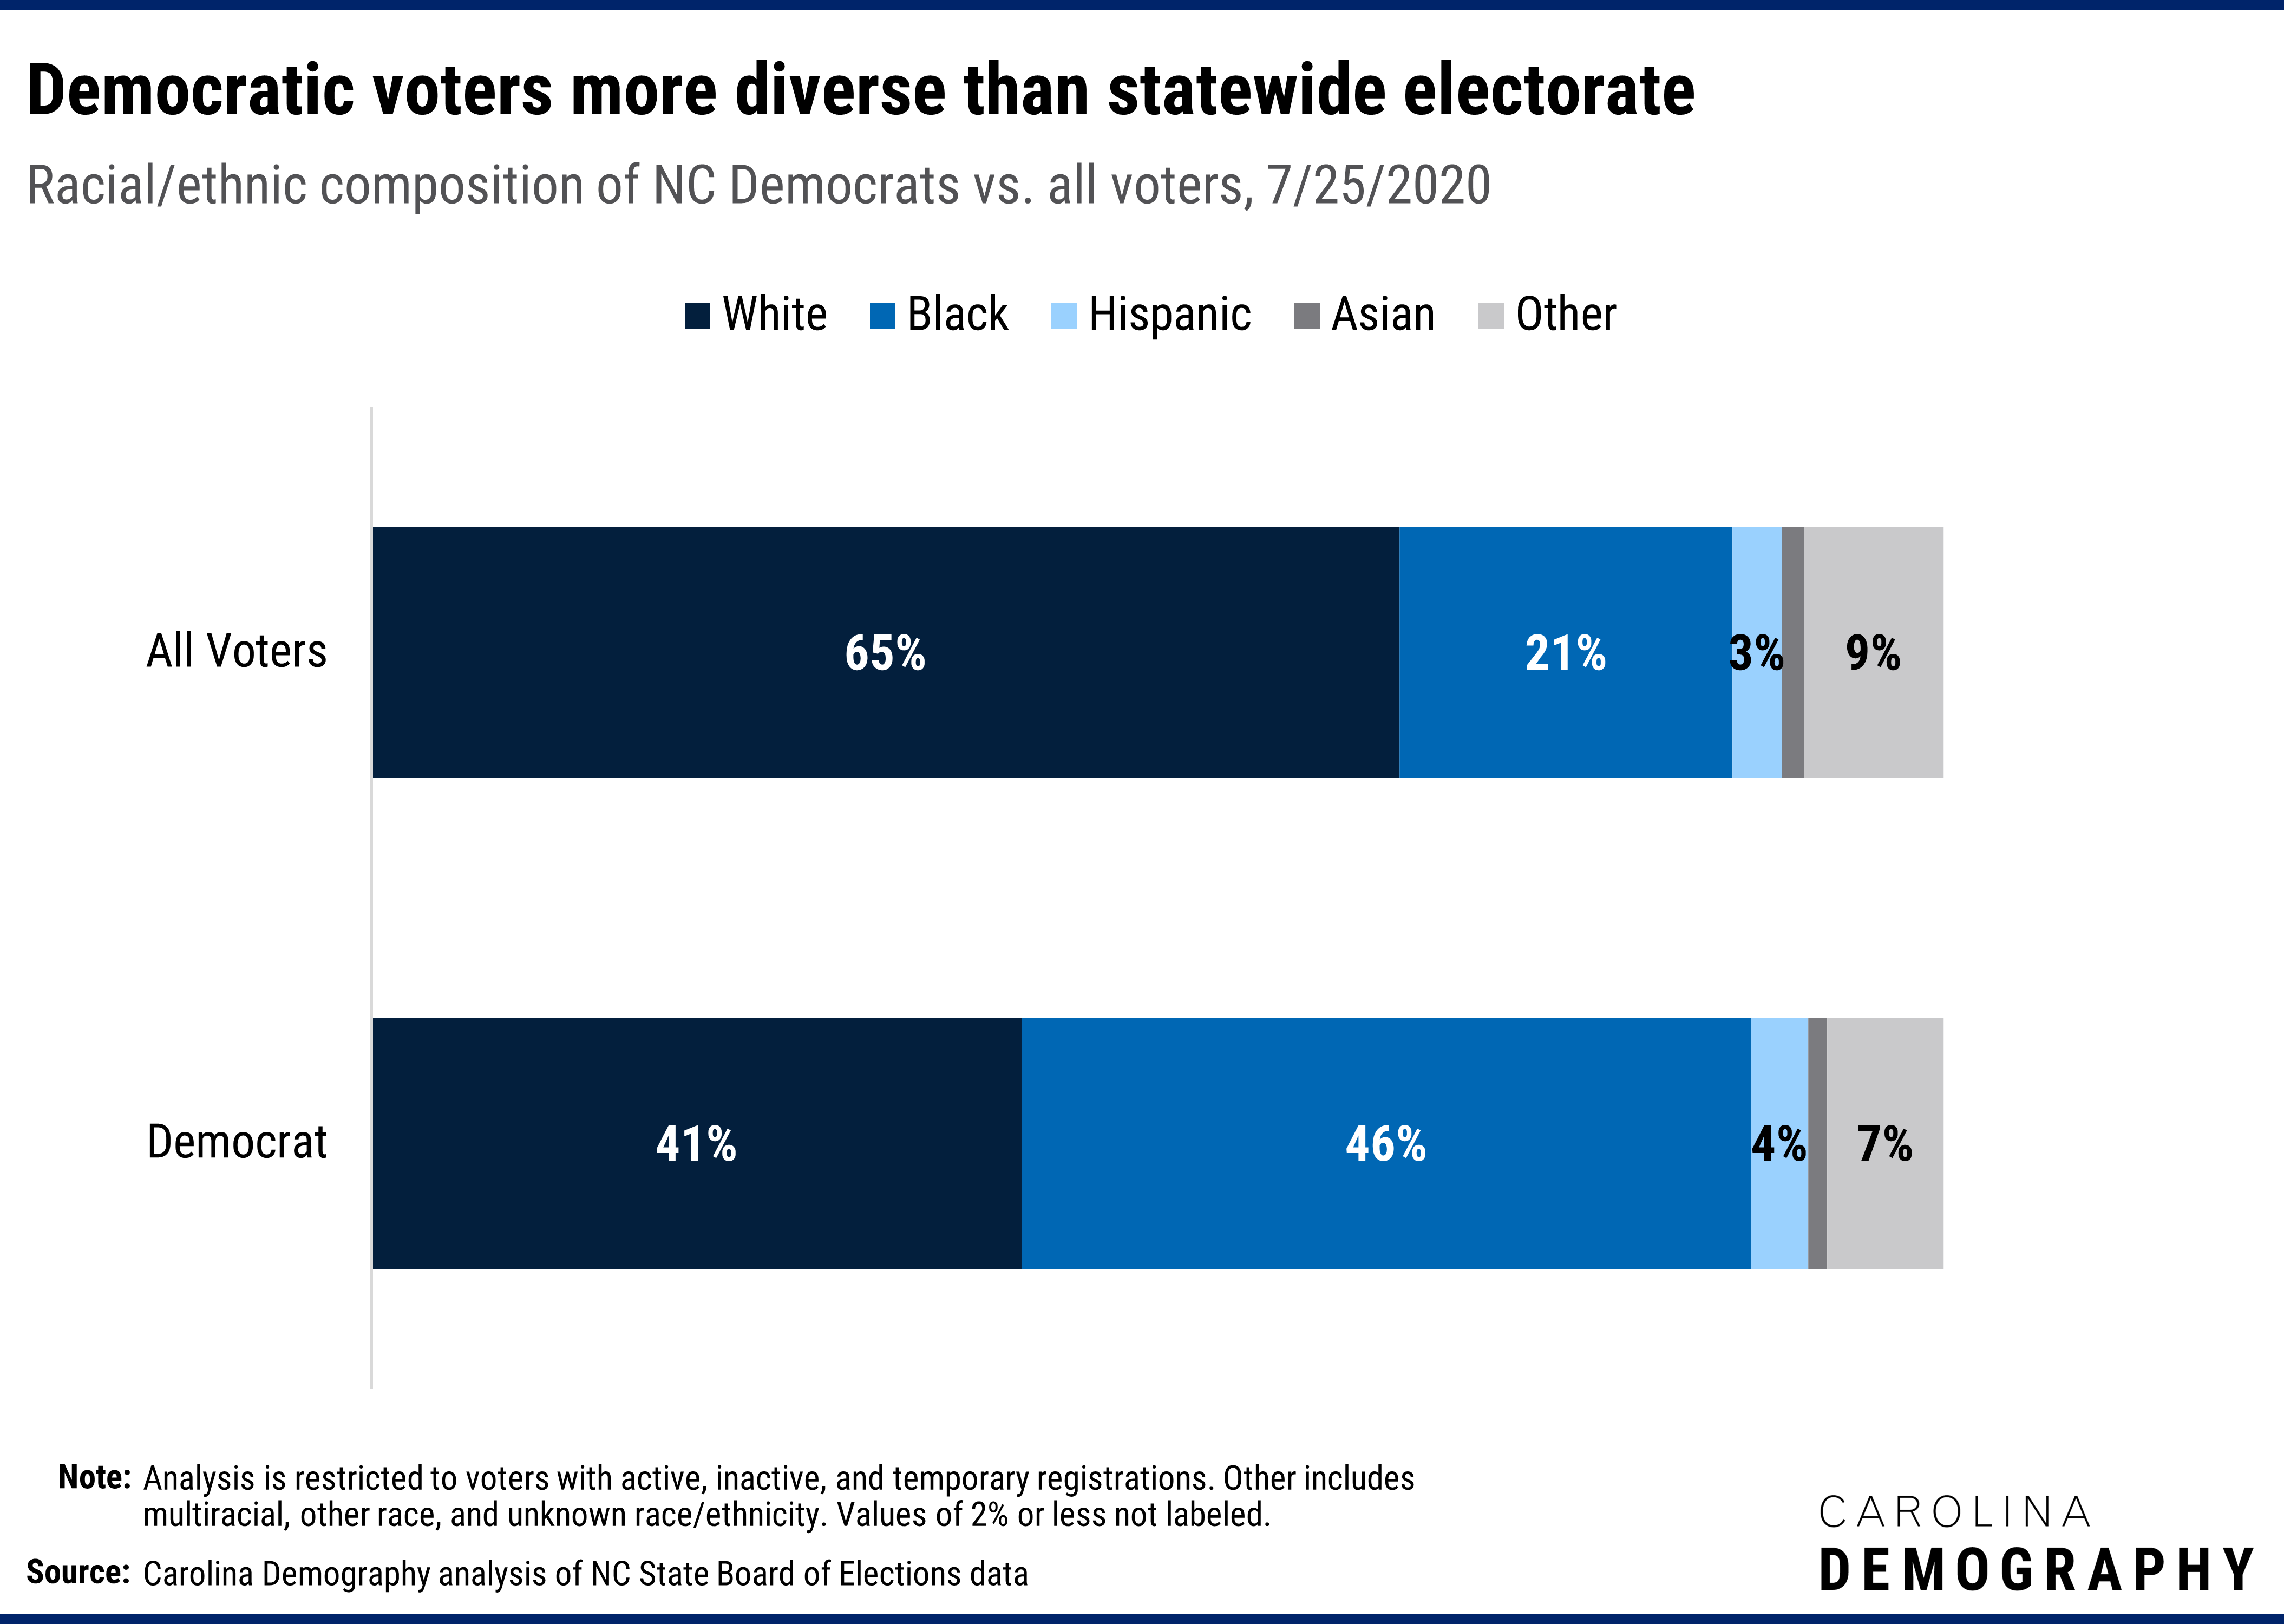
Black voters are significantly more likely to register as a Democrat (79%) compared to other groups. Fifty percent of American Indian voters, 42% of Hispanic voters, 31% of Asian voters, and 23% of white voters are registered Democrat in North Carolina.
Carolina-born voters are more likely to be registered as a Democrat: 42% of South Carolina-born voters and 39% of North Carolina-born voters are registered as Democrats. Current NC voters born in the District of Columbia are the only group more likely to be registered Democrat (51%).
More than 1.1 million Democrat voters—45% of the state’s Democrat voter population—were born in North Carolina. New York (150K), other countries (91K), Virginia (68K), South Carolina (64K), and Pennsylvania (54K) were the next most common birth places. Eighteen percent of Democrat voters (444K) provided no information on place of birth.
Across North Carolina’s 100 counties, the county share of Democrat voters varies widely, reflecting county differences in composition by age, race/ethnicity, and place of birth. Reflecting the inverse of registration patterns for Republican voters, northeastern counties are most likely to register Democrat while many western counties are least likely to register Democrat. Two coastal Carolina counties—Currituck and Carteret—also have low shares of Democrat voters.
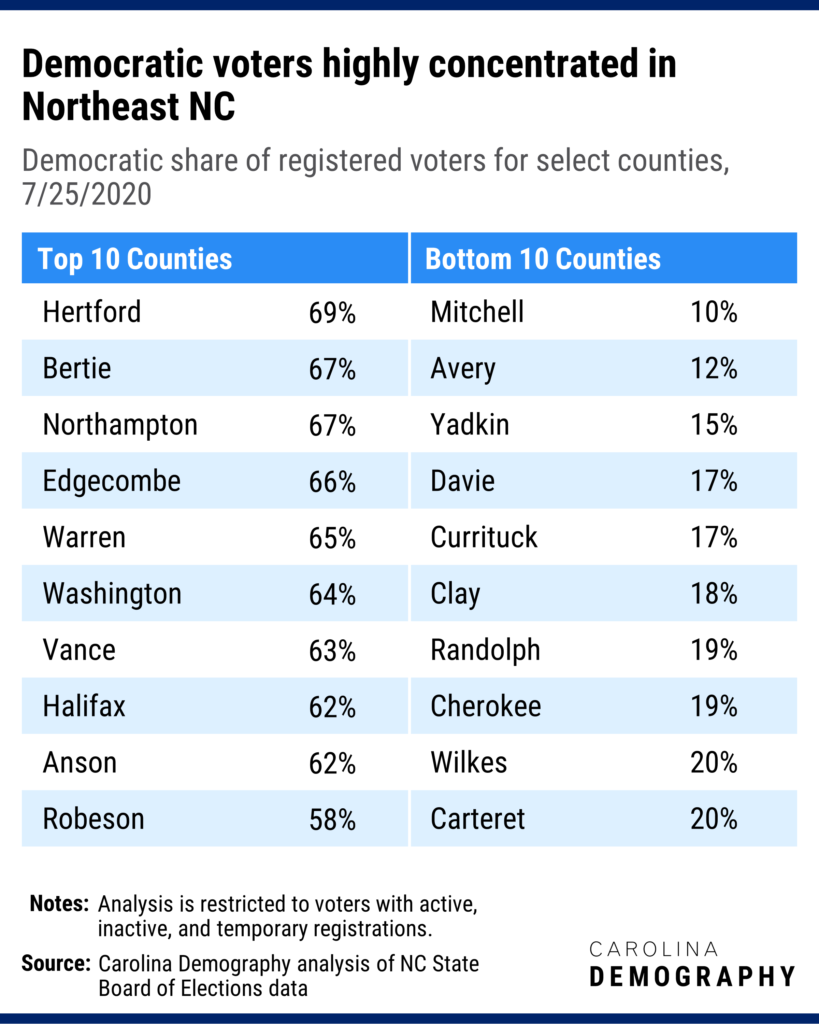
In four counties, more than two of every three registered voters is registered as a Democrat. Sixty-nine percent of registered voters in Hertford County are registered Democrat, the highest rate statewide. (Hertford also has the lowest share of Republican voters.) In contrast, Mitchell County has the lowest share of Democrat voters (10%) but the highest share of Republican voters.
Note: analysis presented is of the 7/25/2020 voter registration file from NC’s State Board of Elections. Analysis is limited to individuals who are active, inactive, or temporary registered voters. Voters with reported birth age of 116 years or older were excluded from the age analysis. Voters with registration dates prior to 1930 were excluded from the registration date analysis.
Need help understanding population change and its impacts on your community or business? Carolina Demography offers demographic research tailored to your needs.
Contact us today for a free initial consultation.
Contact UsCategories: Elections & Voting, NC in Focus

The Center for Women’s Health Research (CWHR) at the University of North Carolina School of Medicine released the 12th edition of our North Carolina Women’s Health Report Card on May 9, 2022. This document is a progress report on the…

Dr. Krista Perreira is a health economist who studies disparities in health, education, and economic well-being. In collaboration with the Urban Institute, she recently co-led a study funded by the Kate B. Reynolds Foundation to study barriers to access to…

Our material helped the NC Local News Lab Fund better understand and then prioritize their funding to better serve existing and future grant recipients in North Carolina. The North Carolina Local News Lab Fund was established in 2017 to strengthen…
Your support is critical to our mission of measuring, understanding, and predicting population change and its impact. Donate to Carolina Demography today.