
This is part of our series looking at NC’s registered voters. Other stories include an overview of NC’s voters and an in-depth look at NC’s Democratic voters.
As of July 25th, 2020, North Carolina had 7 million registered voters. Of these, 2.1 million or 30% were registered as a Republican.
Younger voters are the least likely to register as Republican, reflecting their higher affinity for registering unaffiliated. Just 23% of voters ages 18-34 are registered Republican compared to 30% of 35-54 year-olds, 35% of 55-74 year-olds, and 36% of voters ages 75 and older. As a result, older adults, especially those ages 55-74, comprise a larger share of Republican voters than the overall electorate: 40% of all voters are ages 55+ compared to 47% of registered Republican voters.
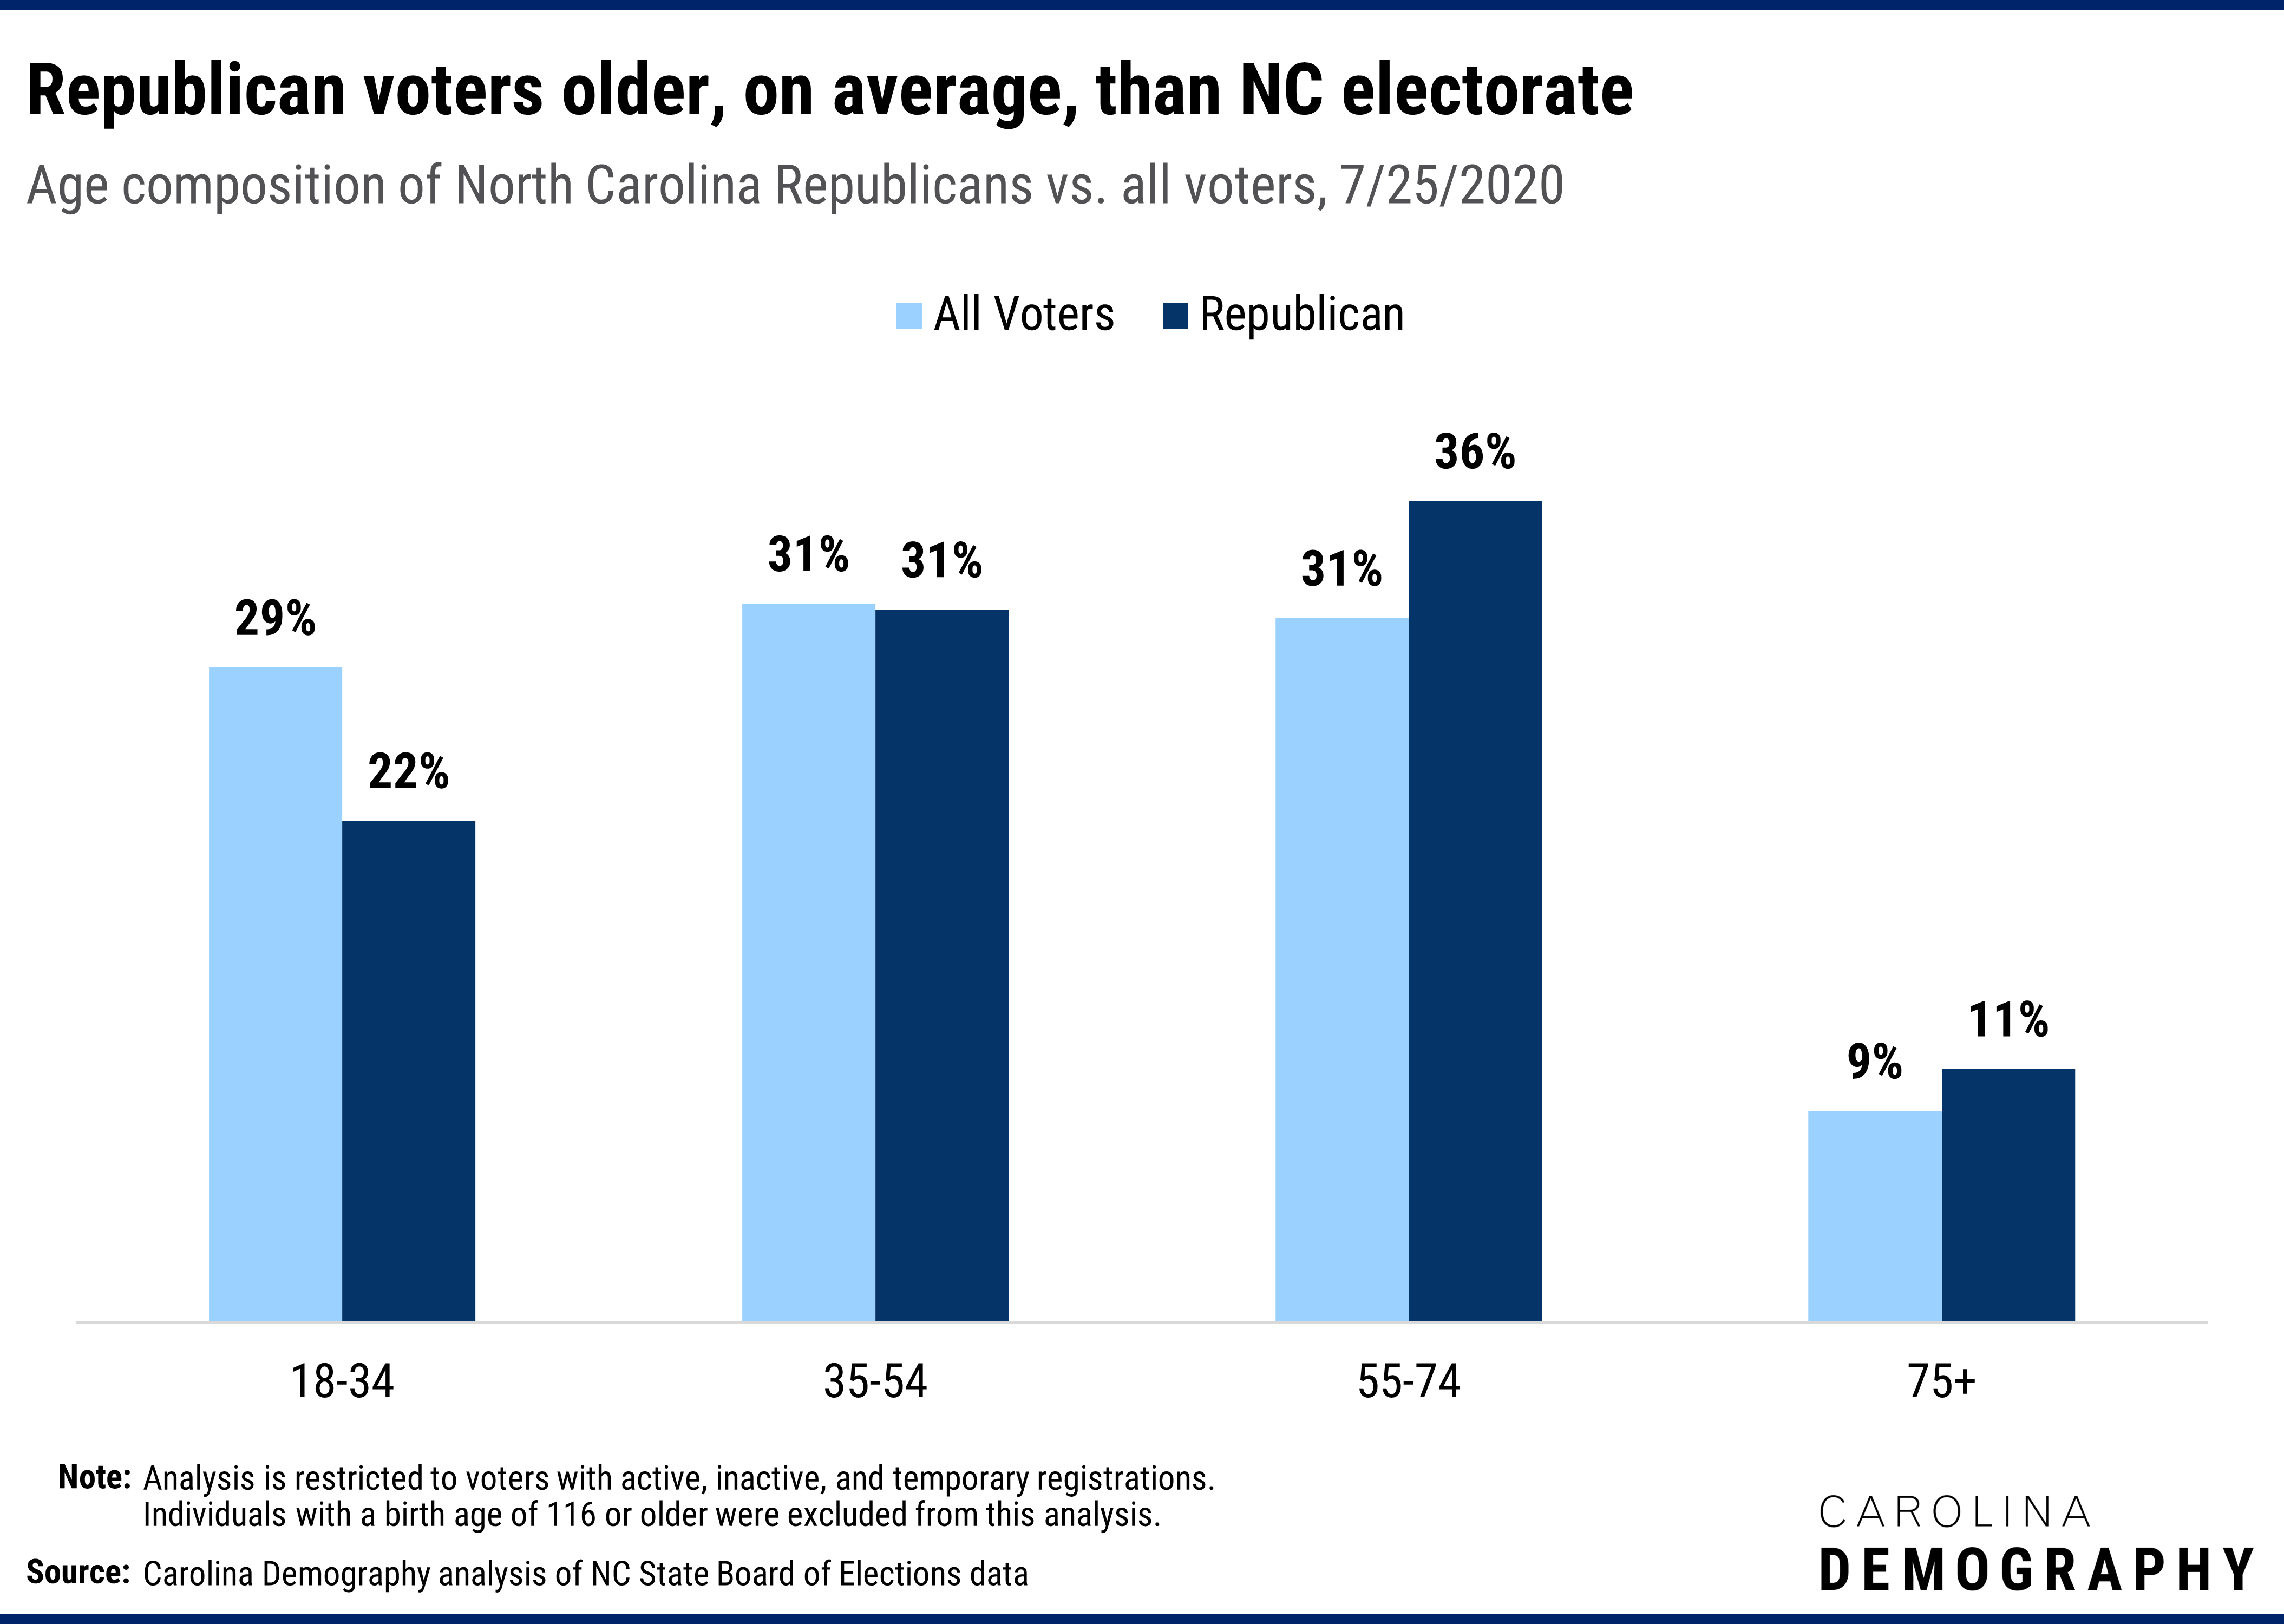
Reflecting this age structure, 15% of North Carolina Republican voters first registered to vote in the state before 1990; 15% registered in the 1990s; 22% in the 2000s; and 48 in 2010 or later.
North Carolina’s registered Republicans are overwhelmingly white. Ninety-two percent of Republican voters are white compared to 67% of the electorate overall.
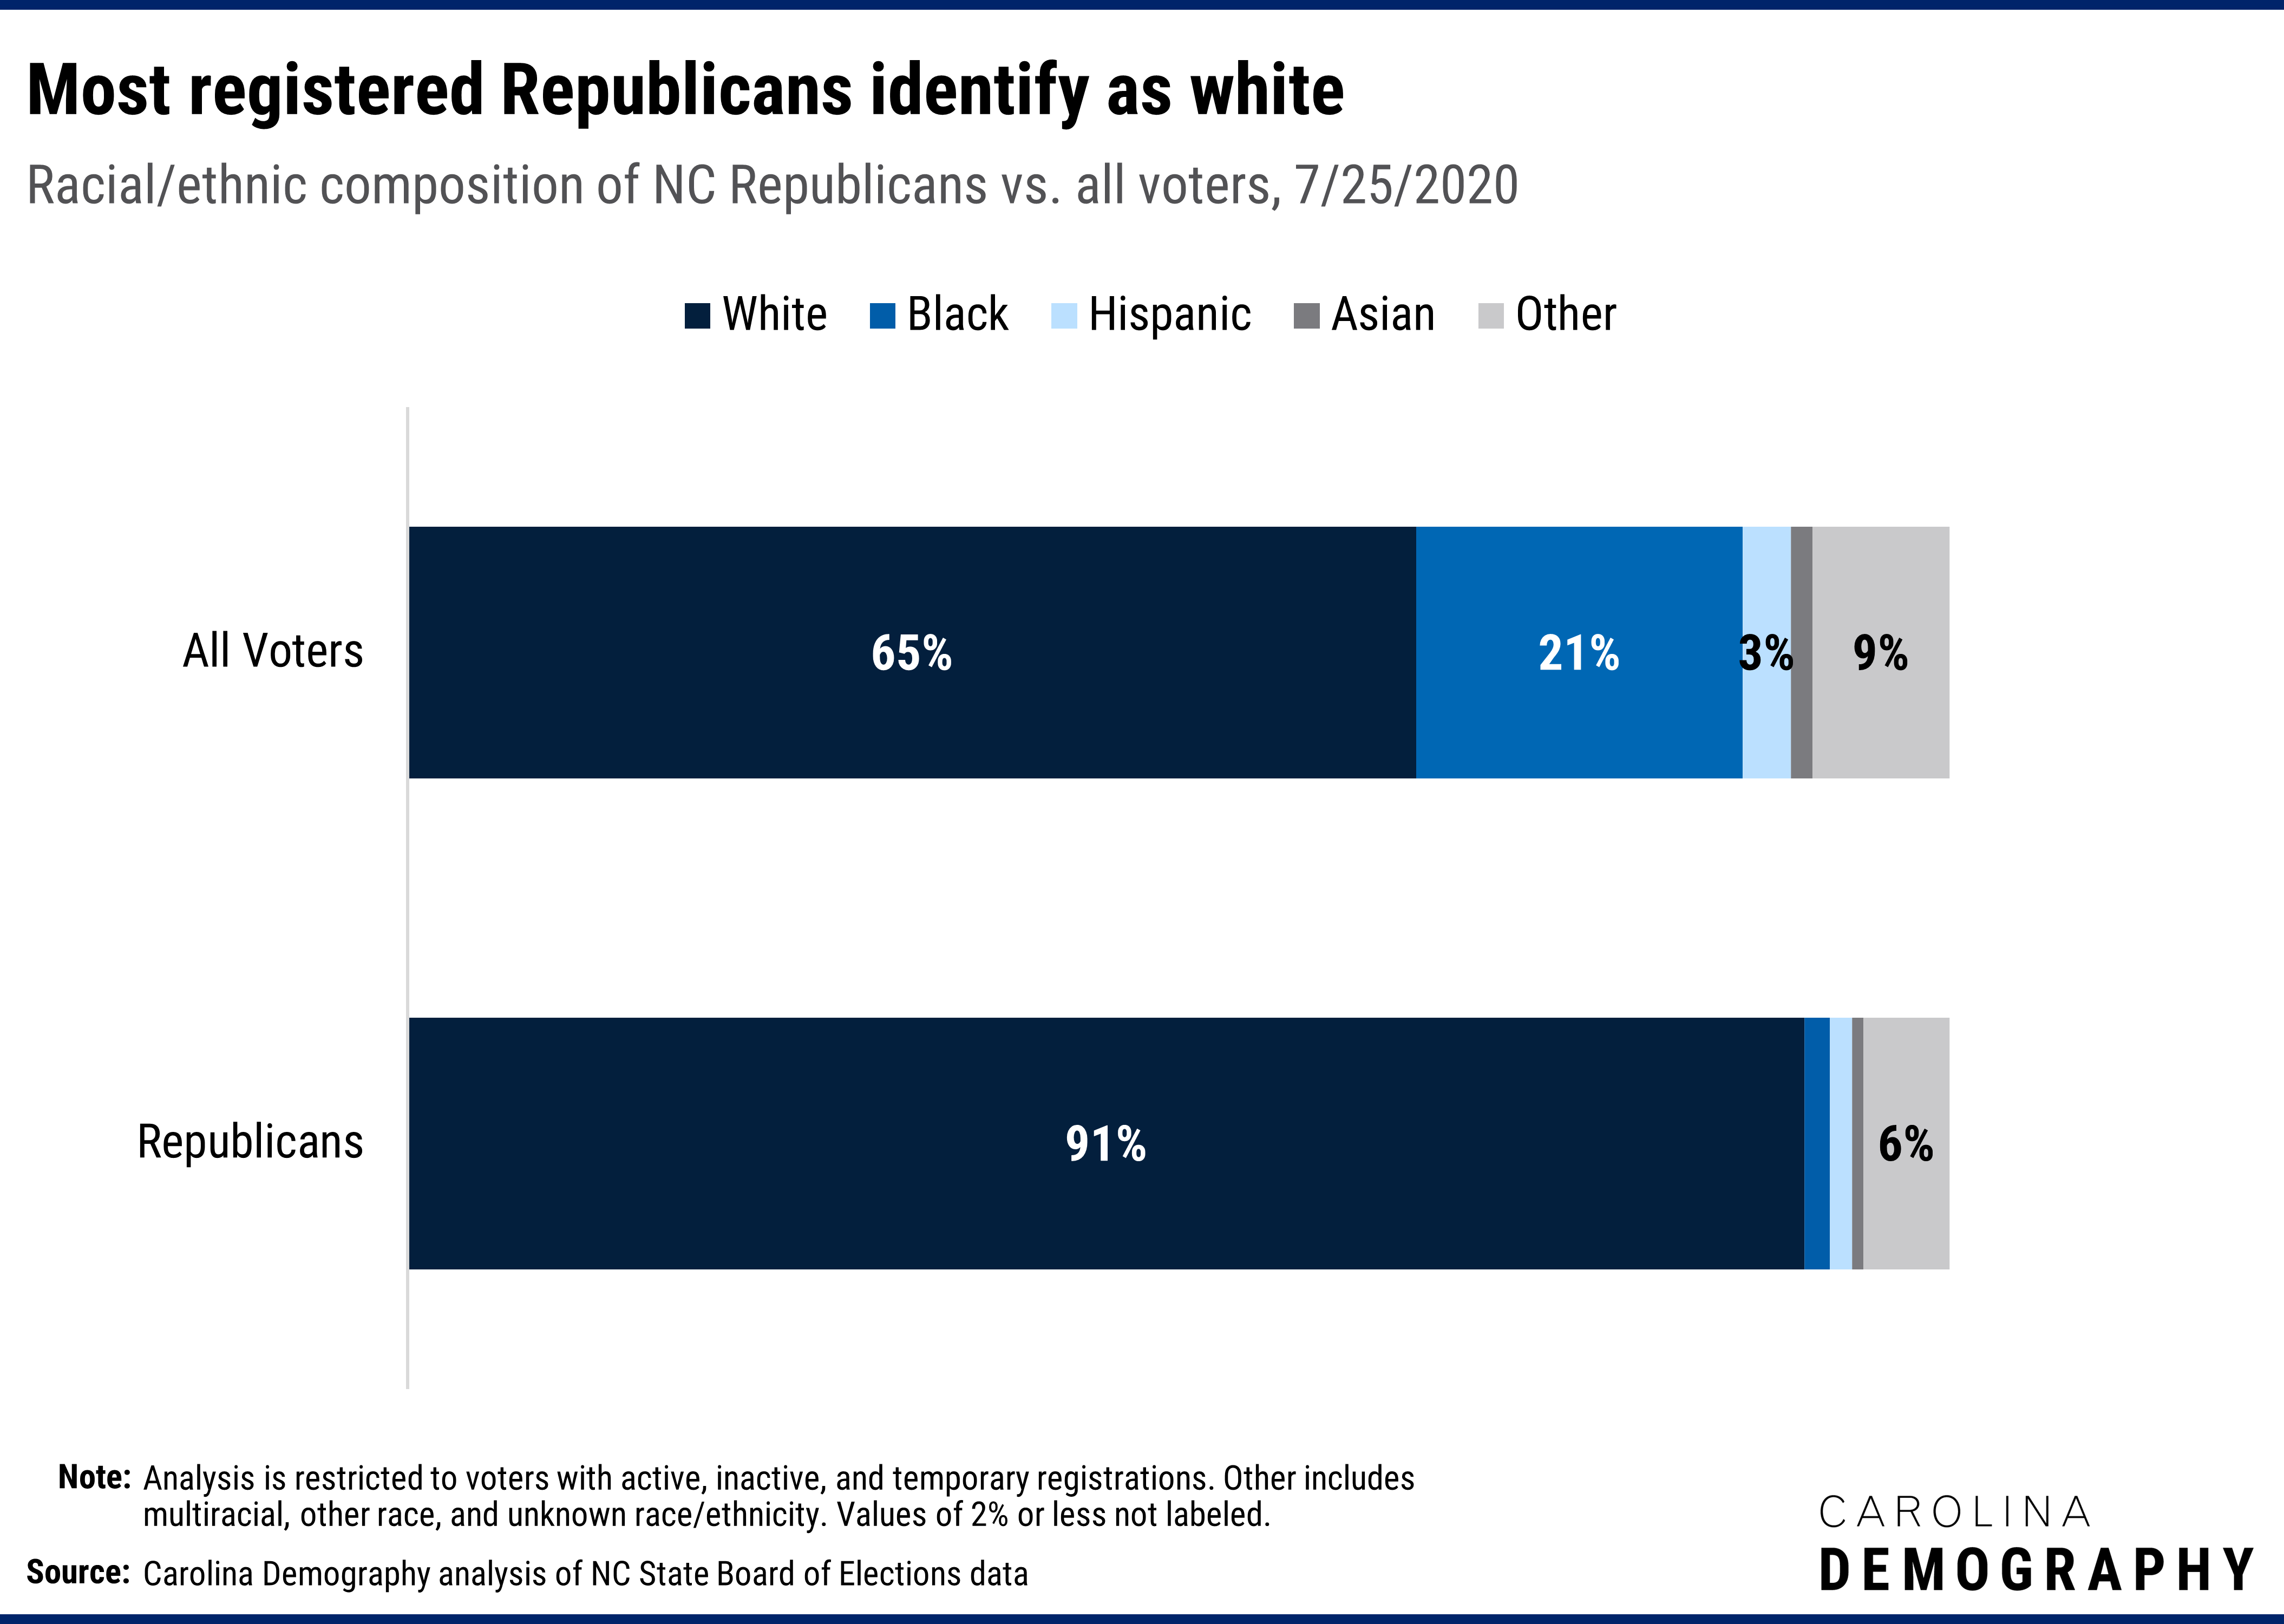
White voters are significantly more likely to register as Republican (41%) compared to other groups. Seventeen percent of American Indian voters, 16% of Asian voters, 14% of Hispanic voters, and 2% of black voters are registered Republican in North Carolina.
North Carolina voters born in a Midwestern state are generally the most likely to be registered as Republican. Forty percent of West Virginia-born individuals are registered Republican, followed by South Dakota (40%), Kentucky (39%), Oklahoma (37%), Indiana (37%), and Nebraska (37%).
Just over 920,000 Republican voters—44% of the state’s Republican voter population—were born in North Carolina. New York (99K), Virginia (71K), Pennsylvania (61K), and Florida (51K) were the next most common birth places. Fourteen percent of Republican voters (304K) provided no information on place of birth.
Across North Carolina’s 100 counties, the county share of Republican voters varies widely, reflecting county differences in composition by age, race/ethnicity, and place of birth. Voters in western counties are generally more likely to register Republican while those in northeastern counties are least likely to register as Republican.
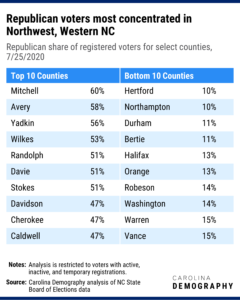
Sixty percent of active voters in Mitchell County were registered Republican, the highest rate statewide. (Mitchell also had the lowest rate of registered Democratic voters.) Over half of registered voters were registered Republican in six other counties: Avery, Yadkin, Wilkes, Randolph, Davie, and Stokes.
In contrast, less than one in nine voters is registered Republican in Hertford, Northampton, Durham, and Bertie counties.
Note: analysis presented is of the 7/25/2020 voter registration file from NC’s State Board of Elections. Analysis is limited to individuals who are active, inactive, or temporary registered voters. Voters with reported birth age of 116 years or older were excluded from the age analysis. Voters with registration dates prior to 1930 were excluded from the registration date analysis.
Need help understanding population change and its impacts on your community or business? Carolina Demography offers demographic research tailored to your needs.
Contact us today for a free initial consultation.
Contact UsCategories: Elections & Voting, NC in Focus

The Center for Women’s Health Research (CWHR) at the University of North Carolina School of Medicine released the 12th edition of our North Carolina Women’s Health Report Card on May 9, 2022. This document is a progress report on the…

Dr. Krista Perreira is a health economist who studies disparities in health, education, and economic well-being. In collaboration with the Urban Institute, she recently co-led a study funded by the Kate B. Reynolds Foundation to study barriers to access to…

Our material helped the NC Local News Lab Fund better understand and then prioritize their funding to better serve existing and future grant recipients in North Carolina. The North Carolina Local News Lab Fund was established in 2017 to strengthen…
Your support is critical to our mission of measuring, understanding, and predicting population change and its impact. Donate to Carolina Demography today.