For the past few months, I’ve wondered: is there a relationship between COVID-19 and absentee ballot requests? Specifically, I hypothesized that absentee ballot requests may increase in communities where COVID-19 rates were higher, perhaps due to increased news coverage and concerns about the virus.
Yesterday, I finally dug into the data for North Carolina counties. I looked at the percent of registered voters who had requested an absentee ballot and the cumulative COVID-19 cases and deaths per 10,000. I found nothing.
There was no immediately visible relationship between COVID-19 cases or deaths per 10,000 residents and the share of county voters who had requested an absentee ballot. In fact, the correlation was slightly negative, meaning that the percent of absentee ballots requested decreased as COVID-19 incidence increased.
Based on earlier analysis, I then looked at whether there was a clear relationship between the county chare of voters registered Democrat and absentee requests (nope). I then looked at county share of voters over age 65 and absentee requests (again, no clear relationship)
What is related to absentee ballot requests at the county level? I took all of the information I had on county voters—party affiliation, race/ethnicity, sex, and age—and on county population (logged, to adjust for outliers) and looked at the relationship between each individual variable and the proportion of absentee requests.
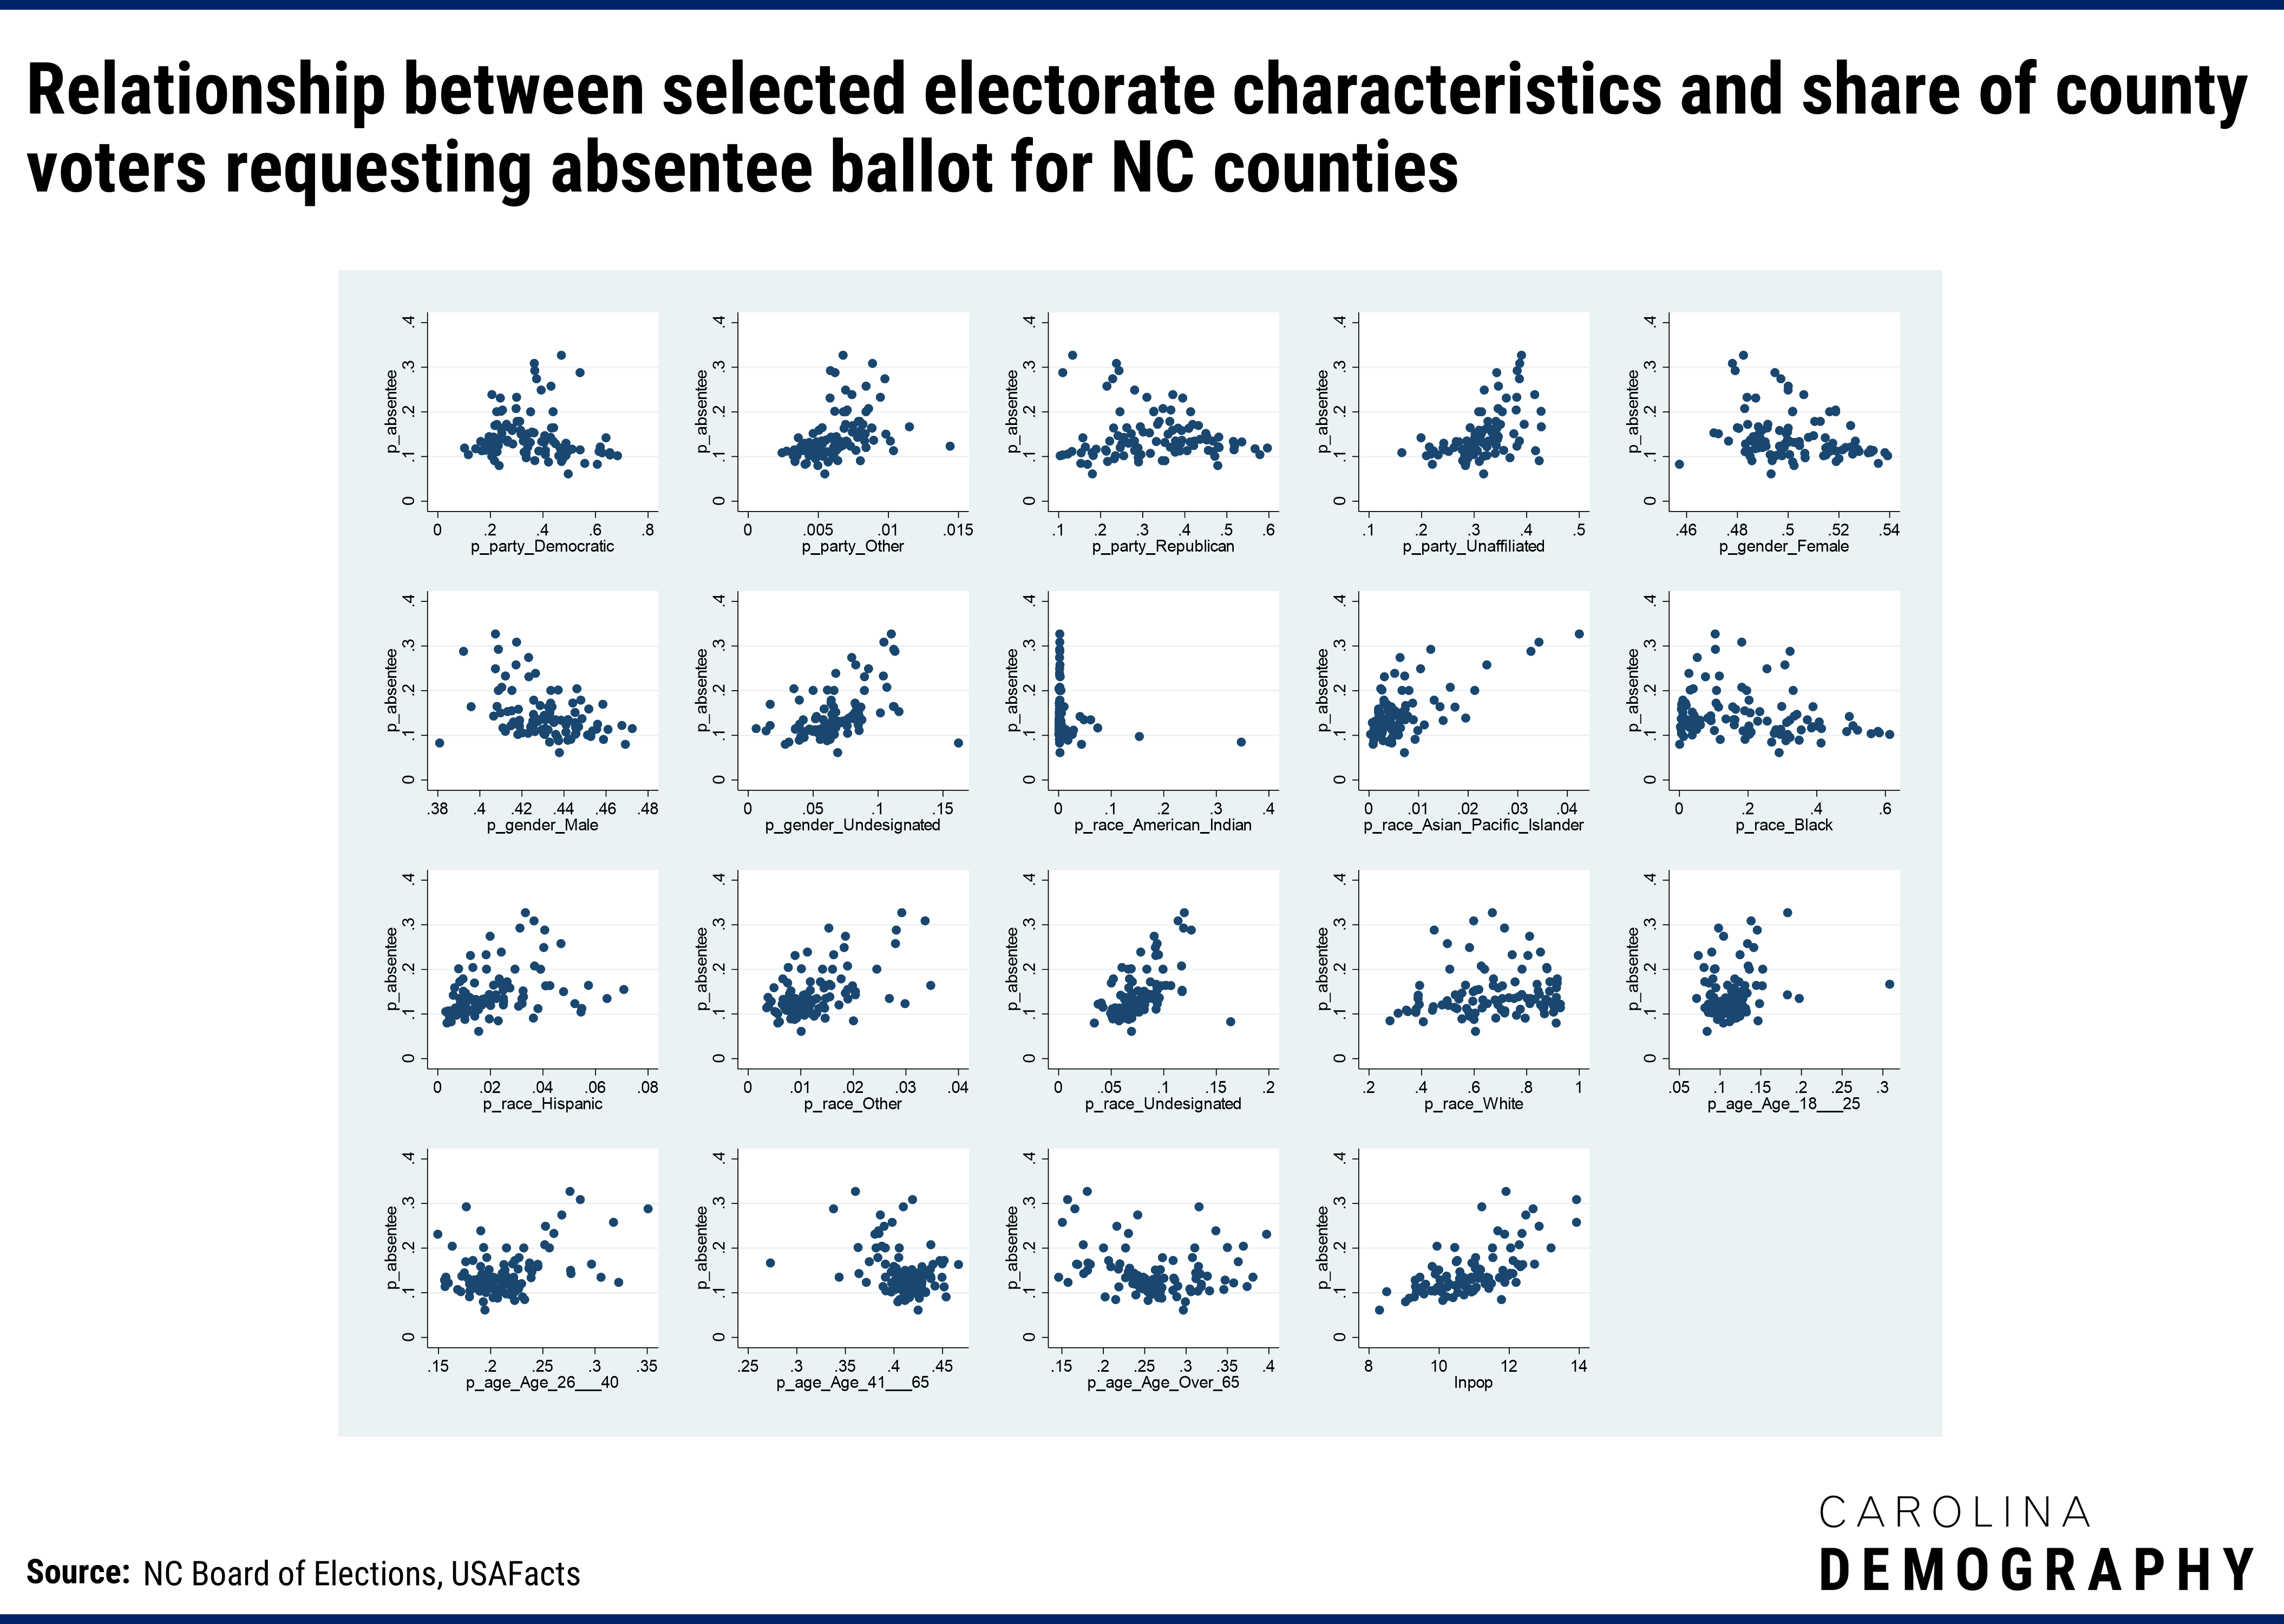
An initial look at scatterplots and bivariate (two-way) correlations suggested that absentee ballot requests were higher in counties where:
In short, the percent of voters requesting an absentee ballot appeared to be related—at the county level—with characteristics most common among newly registered voters in North Carolina.
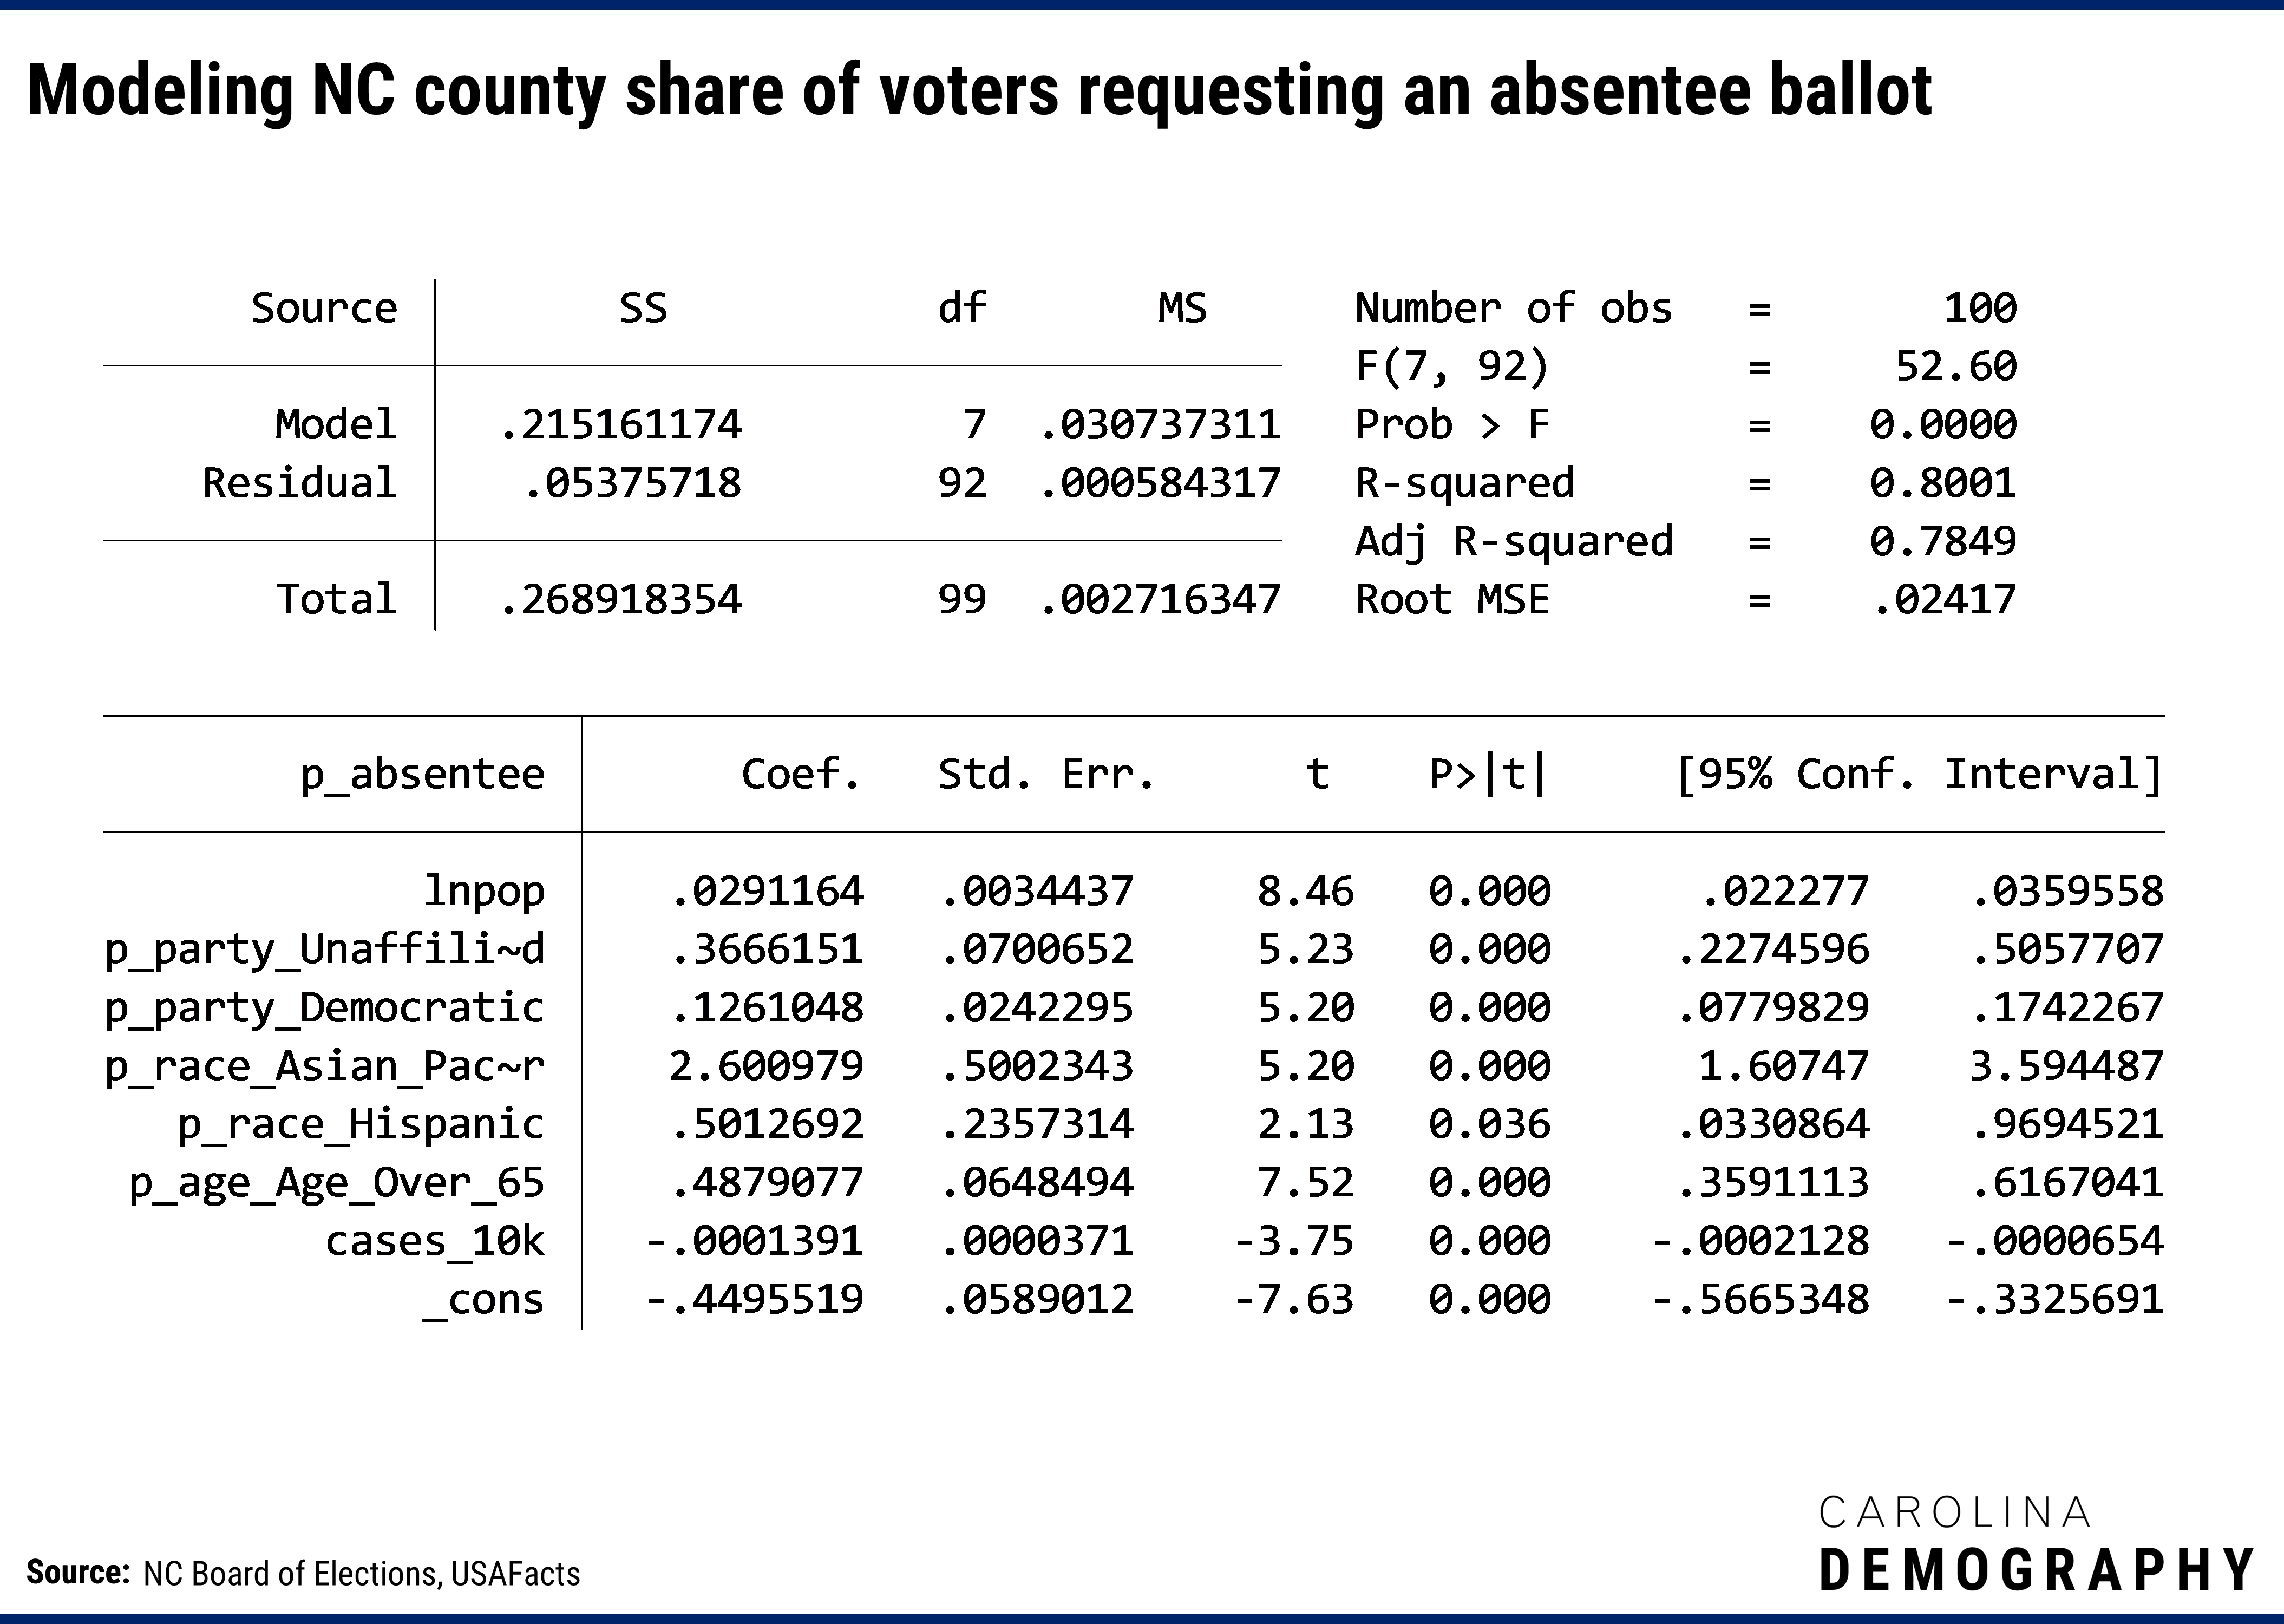
After using linear regression to control for population size, partisan composition (share unaffiliated and share Democratic), and voter race/ethnicity (Asian and Hispanic share), there was a significant positive relationship between the share of voters over age 65 and the proportion of voters who had requested an absentee ballot. Even in this model, COVID-19 cases per 10,000 remained negatively associated with county absentee requests.
I’m limited in this analysis because we only have demographic details on absentee ballot requests at the county level, so I’m working with aggregate, not individual data.
We won’t know individual details on who voted absentee by mail until after the election is over. That data will enable a more granular look, which will allow us to identify individuals who regularly vote absentee by mail versus those who have not voted in North Carolina (or who did voted absentee by mail) in the past.
This detailed data will also enable us to incorporate zip code level COVID-19 incidence to understand whether there is a relationship between the local experience of the pandemic and the desire to vote absentee by mail (or early one-stop) that is not easy to fully understand at the county level.
Data Sources: Voter data is from the NC State Board of Elections. Files used in this analysis include the 10/24/2020 registered voter file (analysis limited to Active, Inactive, and Temporary voter records) and the absentee demographic statistics file (10/28/2020). County data on COVID-19 cases, deaths, and population were obtained from USAFacts and represent cumulative cases and deaths as of 10/27/2020.
Need help understanding population change and its impacts on your community or business? Carolina Demography offers demographic research tailored to your needs.
Contact us today for a free initial consultation.
Contact UsCategories: Elections & Voting, Health & Environment

The Center for Women’s Health Research (CWHR) at the University of North Carolina School of Medicine released the 12th edition of our North Carolina Women’s Health Report Card on May 9, 2022. This document is a progress report on the…

Dr. Krista Perreira is a health economist who studies disparities in health, education, and economic well-being. In collaboration with the Urban Institute, she recently co-led a study funded by the Kate B. Reynolds Foundation to study barriers to access to…

Our material helped the NC Local News Lab Fund better understand and then prioritize their funding to better serve existing and future grant recipients in North Carolina. The North Carolina Local News Lab Fund was established in 2017 to strengthen…
Your support is critical to our mission of measuring, understanding, and predicting population change and its impact. Donate to Carolina Demography today.