
Research has established a strong relationship between high school seniors completing the Free Application for Federal Student Aid (FAFSA) and their likelihood to attend college. FAFSA completion is also a key transition point along the educational continuum. An analysis of data from the National Center for Education Statistics shows that 88% of high school seniors who completed a FAFSA in 2012-13 had attended college by February 2016, compared to 49% of students who did not file a FAFSA.
FAFSA completion is a critical component of working towards the myFutureNC (MFNC) goal of ensuring that 2 million North Carolinians have a postsecondary degree or credential by 2030. But we are now seeing that FAFSA completion rates are also negatively affected by the COVID-19 pandemic, which has created what the UN calls “the largest disruption of education systems in history.”
According to the National College Action Network, as of early September 2020, FAFSA applications for last year’s cycle were down 4.2% compared to the prior year.
In our focused statewide analysis, we looked at FAFSA completion at North Carolina’s public schools as of the end of June 2020. Among traditional public schools, the statewide average was down 1.3 percentage points: 51.5% of high school seniors had completed the FAFSA in June 2020 compared to 52.8% of students the year before, in June 2019.
The Cape Fear area—Bladen, Brunswick, Columbus, New Hanover, Onslow and Pender counties—saw an even more dramatic gap between their 2020 completion rates and their 2019 completion rates. Regionally, the FAFSA completion rate declined more than two percentage points, from 47.2% to 44.9%. That translates to 137 fewer seniors who did not fill out the FAFSA.
The largest decrease in this area occurred in Columbus County, where FAFSA completion rates fell by 12.4 percentage points (pp), followed by Brunswick (-2.2 pp), Onslow (-2.7 pp), and Pender (-1.8 pp) counties. New Hanover County held relatively constant, seeing a less than one percentage point decline. In contrast to these declines, Bladen County raised their completion rate 5.5 percentage points from 2019 to 2020.
COVID-19 numbers have continued to increase in the Cape Fear region. Columbus County specifically has the largest number of total cases per 10,000 residents in the Cape Fear area since the beginning of the pandemic, at 819 cases as of January 19, according to the NC DHHS.
The volume of COVID-19 cases has forced students to complete their schoolwork, and parts of their college application process, like the FAFSA, at home. Most high schools in the area ended the 2019-2020 academic year virtually. This can create additional concern, especially without the in-person support of school counselors and proper technology or connectivity to seek assistance.
According to the 2018 American Community Survey, 80% of households in the Cape Fear area have access to a computer with internet access at home, just above the statewide average of 79%. However, this value varies greatly throughout the region. In Columbus County, where FAFSA completion rates declined the most during the observed time period, this share is only 62%, the lowest percentage in the Cape Fear area.
We also see that one in four Columbus County residents are living in poverty, which can make it challenging to afford the technology necessary to complete the FAFSA. Across the region, 16% of Cape Fear residents are currently living in poverty, slightly higher than the statewide value of 15%.
Most schools started the new school year the same as they ended the last, with students and teachers working from home. Many families are likely worse off financially now than they were in June, creating further stress with their children still at home and needing additional resources for their educational attainment.
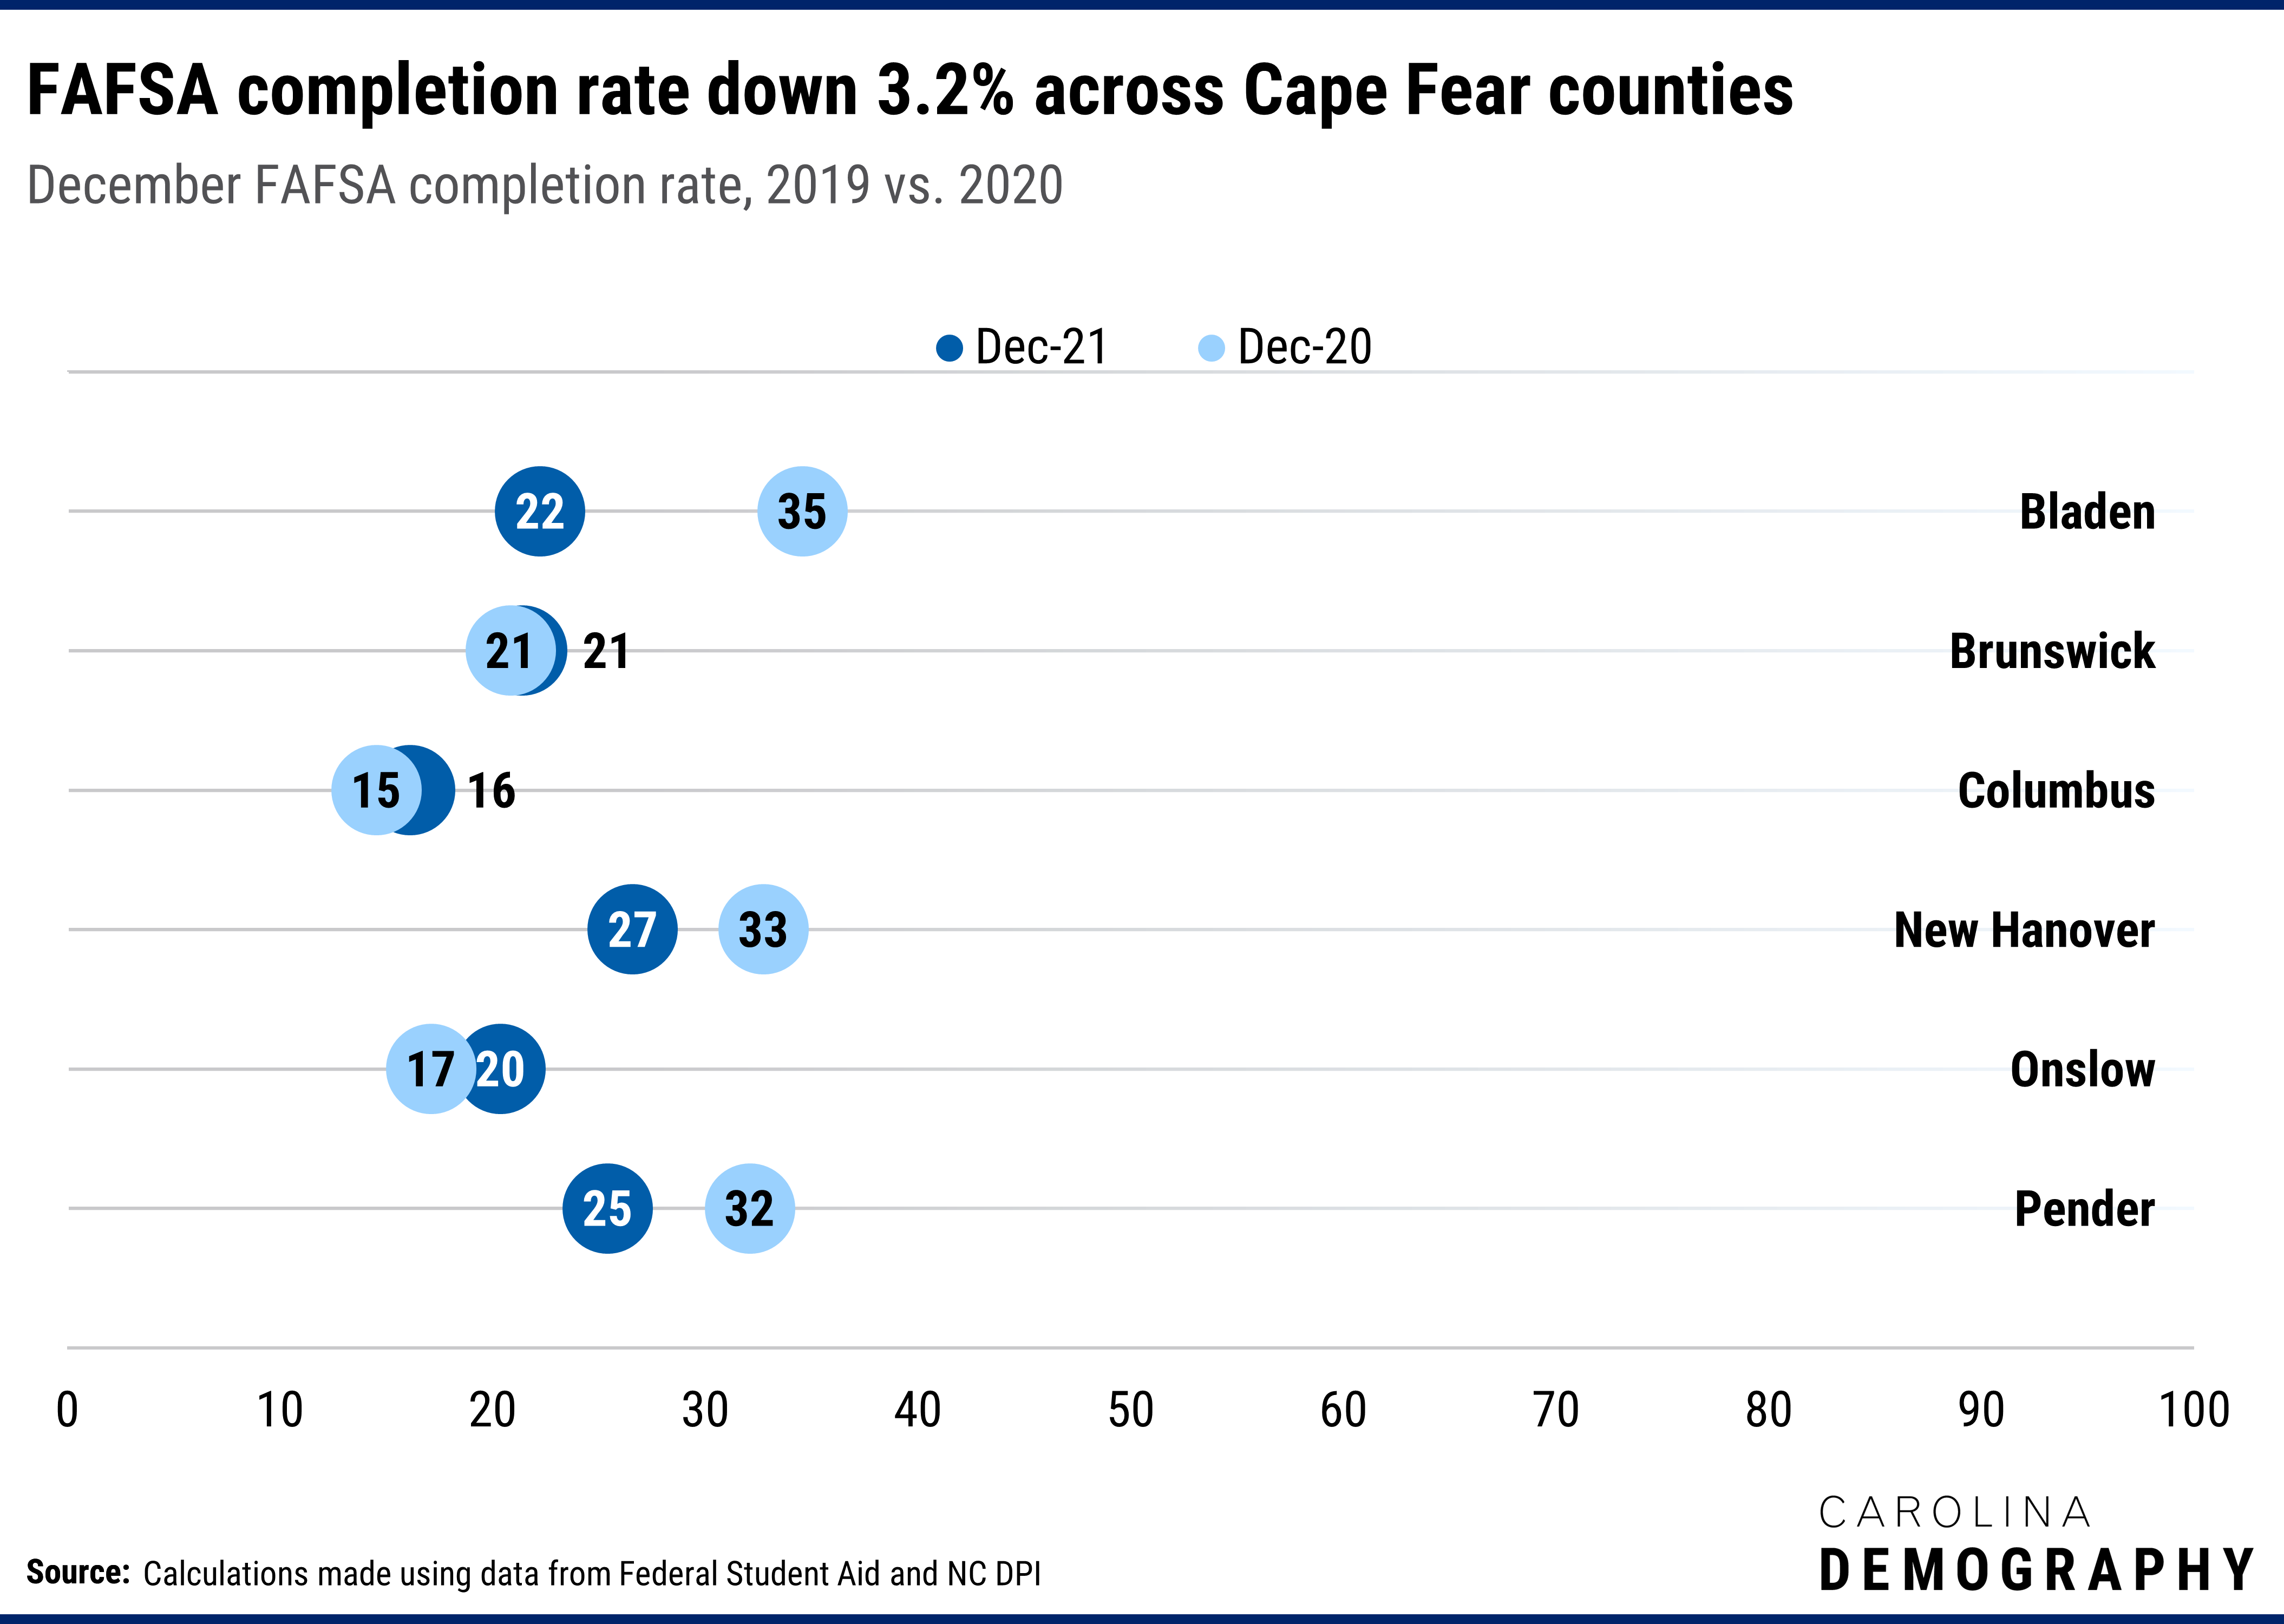
As of December 31st, the Cape Fear Region is currently down 3.2 percentage points relative to their FAFSA completion rate in 2019; this represents more than 200 students who have not completed the form compared to last year. Some individual counties have seen even larger declines: Bladen County has had the steepest drop with a 12.3 percentage point decrease from year to year.
Bladen also has had the second highest number of COVID-19 cases per 10,000 in the area since the pandemic began, at 705 persons as of January 19, according to the NC DHHS. The statewide value for the same statistic is 653. Such a high rate could continue to keep students attending school virtually from their homes. Bladen [TRM7] has the second lowest percentage of residents in the six-county region who have access to broadband internet access and/or own a computer.
FAFSA awards are need based and dependent on the income level of the applicant’s household. Due to the instability of today’s economy, the financial positions of these families will likely continue to fluctuate. This can create additional concerns, especially without the in-person support of school counselors and proper technology or connectivity to seek assistance.
Schools know their communities well and need a way to track the FAFSA completion rate within their own communities. We recently worked with MyFutureNC to create a tool that allows school counselors and administrators to view their current estimated completion percentages, track their progress over time, compare to other schools, and even view district level totals. You can access the FAFSA tracker here: https://www.myfuturenc.org/first-in-fafsa/
Need help understanding population change and its impacts on your community or business? Carolina Demography offers demographic research tailored to your needs.
Contact us today for a free initial consultation.
Contact UsCategories: Education

The Center for Women’s Health Research (CWHR) at the University of North Carolina School of Medicine released the 12th edition of our North Carolina Women’s Health Report Card on May 9, 2022. This document is a progress report on the…

Dr. Krista Perreira is a health economist who studies disparities in health, education, and economic well-being. In collaboration with the Urban Institute, she recently co-led a study funded by the Kate B. Reynolds Foundation to study barriers to access to…

Our material helped the NC Local News Lab Fund better understand and then prioritize their funding to better serve existing and future grant recipients in North Carolina. The North Carolina Local News Lab Fund was established in 2017 to strengthen…
Your support is critical to our mission of measuring, understanding, and predicting population change and its impact. Donate to Carolina Demography today.