
Across the country, fewer students are showing up in traditional public schools because of the ongoing COVID-19 pandemic. We have looked at attendance data from the North Carolina Department of Public Instruction to understand how declines in enrollment vary across the state and which grades are impacted.
Average Daily Membership (ADM) is considered the most accurate metric for how many students are in a school. Schools are funded based on their forecasted ADM. For this year, the North Carolina General Assembly passed a bill that holds districts harmless for ADM declines.
Statewide, nearly 63,000 fewer students were attending public schools in Month 2 of 2020-21 compared to 2019-20, a loss of -4.4%.
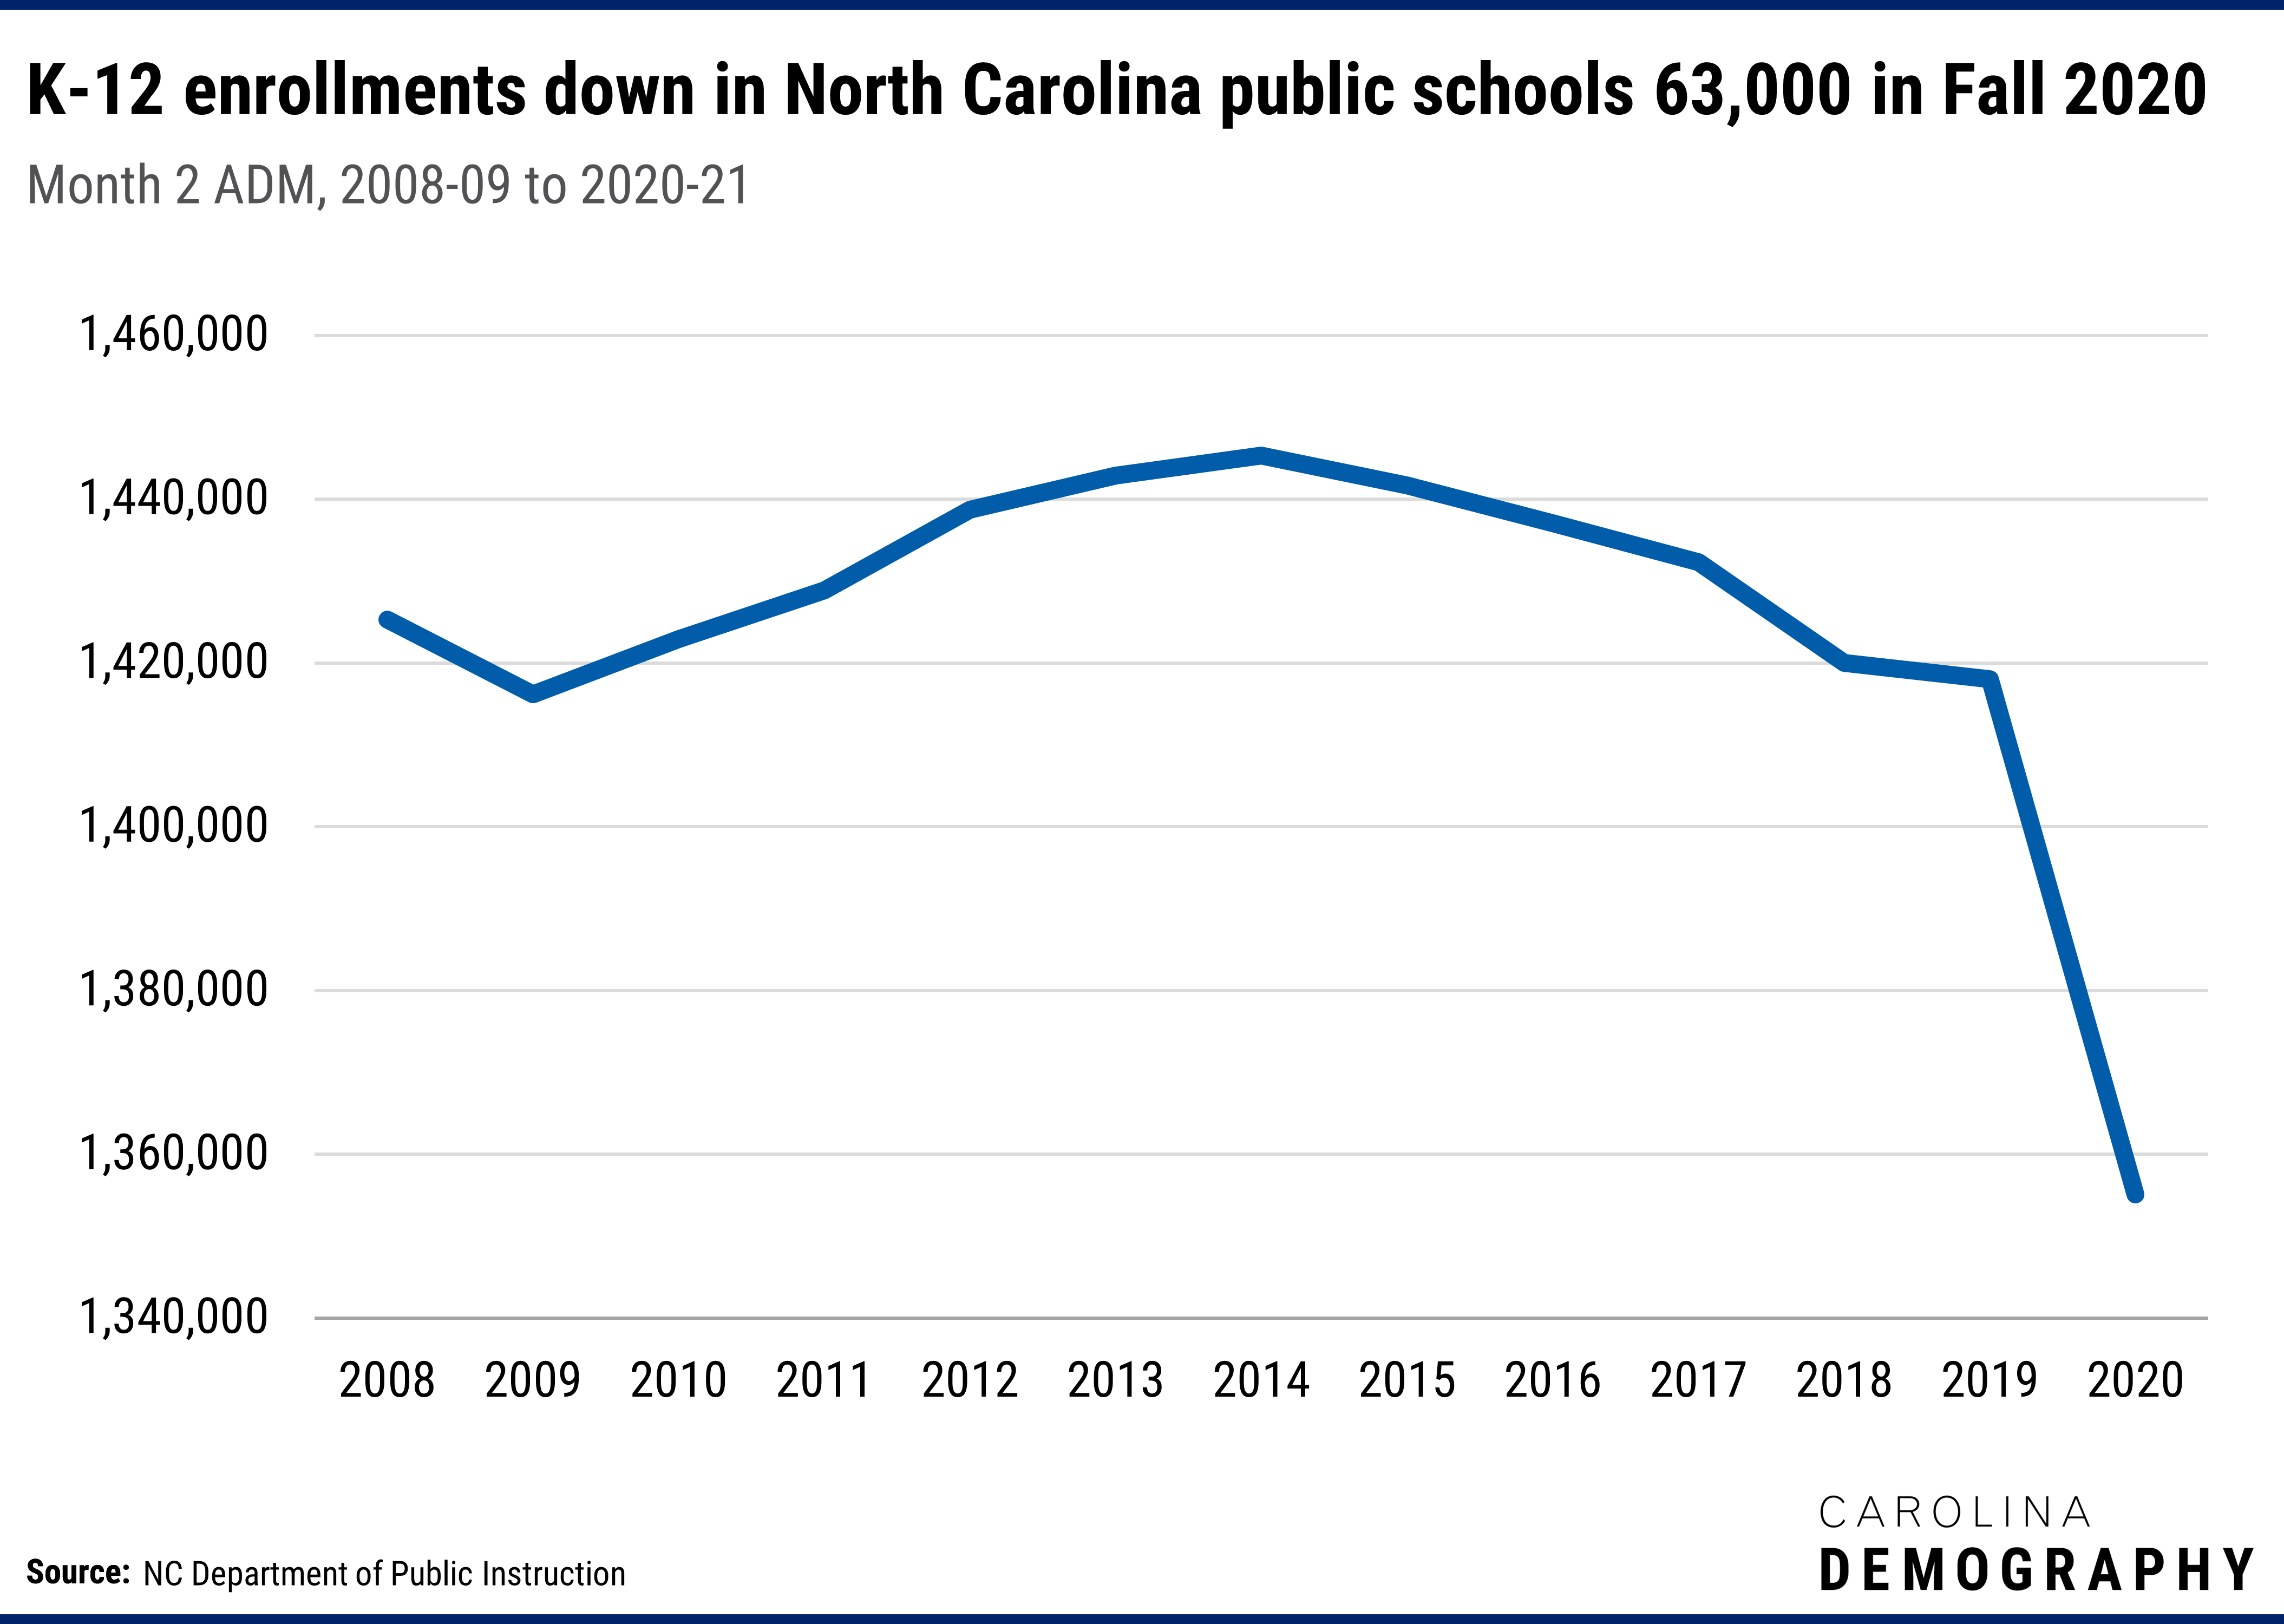
Public school enrollments had been slowly declining since 2015-16, reflecting two factors:
The decline in ADM this past fall was five times larger than the largest decline previously observed (between 2017-18 and 2018-19).
Statewide, only two public school systems reported higher Month 2 ADM in 2020-21 over 2019-20:
All other school districts had ADM declines of at least one percent or greater, with Rowan-Salisbury Schools and Weldon City Schools reporting ADM losses of nearly eighteen percent.
| District Name | 2019-20 | 2020-21 | Change | % Change |
|---|---|---|---|---|
| North Carolina Total | 1,418,051 | 1,355,120 | -62,931 | -4.4% |
| Charlotte-Mecklenburg Schools | 146,939 | 138,884 | -8,055 | -5.5% |
| Wake County Schools | 161,907 | 157,673 | -4,234 | -2.6% |
| Rowan-Salisbury Schools | 18,710 | 15,418 | -3,292 | -17.6% |
| Winston Salem/Forsyth County Schools | 53,653 | 50,407 | -3,246 | -6.0% |
| Guilford County Schools | 71,151 | 68,264 | -2,887 | -4.1% |
| Cumberland County Schools | 49,936 | 48,185 | -1,751 | -3.5% |
| Durham Public Schools | 32,851 | 31,171 | -1,680 | -5.1% |
| Union County Public Schools | 41,394 | 39,727 | -1,667 | -4.0% |
| Buncombe County Schools | 23,665 | 22,031 | -1,634 | -6.9% |
| Alamance-Burlington Schools | 22,893 | 21,401 | -1,492 | -6.5% |
| Gaston County Schools | 30,798 | 29,318 | -1,480 | -4.8% |
| New Hanover County Schools | 25,761 | 24,368 | -1,393 | -5.4% |
| Nash-Rocky Mount Schools | 14,988 | 13,896 | -1,092 | -7.3% |
| Johnston County Schools | 36,878 | 35,906 | -972 | -2.6% |
| Cabarrus County Schools | 33,590 | 32,668 | -922 | -2.7% |
| Harnett County Schools | 20,147 | 19,256 | -891 | -4.4% |
| Craven County Schools | 13,272 | 12,460 | -812 | -6.1% |
| Davidson County Schools | 18,557 | 17,751 | -806 | -4.3% |
| Public Schools Of Robeson County | 21,270 | 20,478 | -792 | -3.7% |
| Wayne County Public Schools | 17,997 | 17,223 | -774 | -4.3% |
| Rockingham County Schools | 11,550 | 10,825 | -725 | -6.3% |
| Randolph County School System | 15,758 | 15,049 | -709 | -4.5% |
| Lee County Schools | 9,873 | 9,174 | -699 | -7.1% |
| Pitt County Schools | 23,520 | 22,838 | -682 | -2.9% |
| Onslow County Schools | 26,789 | 26,142 | -647 | -2.4% |
| Caldwell County Schools | 11,205 | 10,591 | -614 | -5.5% |
| Wilson County Schools | 10,921 | 10,315 | -606 | -5.5% |
| Chapel Hill-Carrboro City Schools | 12,304 | 11,764 | -540 | -4.4% |
| Brunswick County Schools | 12,566 | 12,060 | -506 | -4.0% |
| Wilkes County Schools | 8,967 | 8,469 | -498 | -5.6% |
| Burke County Schools | 11,872 | 11,392 | -480 | -4.0% |
| Elizabeth City-Pasquotank Public Schools | 5,214 | 4,749 | -465 | -8.9% |
| Henderson County Schools | 13,392 | 12,927 | -465 | -3.5% |
| Hoke County Schools | 8,792 | 8,342 | -450 | -5.1% |
| Richmond County Schools | 6,982 | 6,549 | -433 | -6.2% |
| Sampson County Schools | 7,985 | 7,555 | -430 | -5.4% |
| Beaufort County Schools | 6,302 | 5,887 | -415 | -6.6% |
| Moore County Schools | 12,775 | 12,363 | -412 | -3.2% |
| Iredell-Statesville Schools | 20,403 | 20,001 | -402 | -2.0% |
| Granville County Schools | 7,212 | 6,816 | -396 | -5.5% |
| Catawba County Schools | 15,711 | 15,335 | -376 | -2.4% |
| Haywood County Schools | 7,074 | 6,707 | -367 | -5.2% |
| Chatham County Schools | 8,963 | 8,612 | -351 | -3.9% |
| Lincoln County Schools | 11,360 | 11,019 | -341 | -3.0% |
| Orange County Schools | 7,365 | 7,031 | -334 | -4.5% |
| Stokes County Schools | 5,787 | 5,455 | -332 | -5.7% |
| Davie County Schools | 6,085 | 5,766 | -319 | -5.2% |
| Vance County Schools | 5,270 | 4,954 | -316 | -6.0% |
| Carteret County Public Schools | 8,058 | 7,743 | -315 | -3.9% |
| Edgecombe County Public Schools | 5,609 | 5,294 | -315 | -5.6% |
| Franklin County Schools | 8,037 | 7,724 | -313 | -3.9% |
| Scotland County Schools | 5,579 | 5,272 | -307 | -5.5% |
| Cleveland County Schools | 14,092 | 13,791 | -301 | -2.1% |
| Surry County Schools | 7,409 | 7,113 | -296 | -4.0% |
| Hickory City Schools | 4,111 | 3,822 | -289 | -7.0% |
| Rutherford County Schools | 7,593 | 7,308 | -285 | -3.8% |
| Lenoir County Public Schools | 8,465 | 8,207 | -258 | -3.0% |
| Cherokee County Schools | 3,079 | 2,832 | -247 | -8.0% |
| Alexander County Schools | 4,735 | 4,489 | -246 | -5.2% |
| Duplin County Schools | 9,634 | 9,394 | -240 | -2.5% |
| Mcdowell County Schools | 5,911 | 5,677 | -234 | -4.0% |
| Columbus County Schools | 5,387 | 5,162 | -225 | -4.2% |
| Pender County Schools | 9,569 | 9,344 | -225 | -2.4% |
| Dare County Schools | 5,254 | 5,031 | -223 | -4.2% |
| Bladen County Schools | 4,084 | 3,868 | -216 | -5.3% |
| Anson County Schools | 3,141 | 2,949 | -192 | -6.1% |
| Thomasville City Schools | 2,261 | 2,070 | -191 | -8.4% |
| Montgomery County Schools | 3,684 | 3,495 | -189 | -5.1% |
| Watauga County Schools | 4,657 | 4,468 | -189 | -4.1% |
| Roanoke Rapids City Schools | 2,760 | 2,573 | -187 | -6.8% |
| Yancey County Schools | 2,071 | 1,899 | -172 | -8.3% |
| Greene County Schools | 2,870 | 2,700 | -170 | -5.9% |
| Transylvania County Schools | 3,341 | 3,181 | -160 | -4.8% |
| Northampton County Schools | 1,393 | 1,234 | -159 | -11.4% |
| Washington County Schools | 1,169 | 1,014 | -155 | -13.3% |
| Martin County Schools | 2,787 | 2,636 | -151 | -5.4% |
| Macon County Schools | 4,447 | 4,300 | -147 | -3.3% |
| Bertie County Schools | 1,982 | 1,844 | -138 | -7.0% |
| Newton Conover City Schools | 2,917 | 2,780 | -137 | -4.7% |
| Whiteville City Schools | 2,186 | 2,050 | -136 | -6.2% |
| Weldon City Schools | 755 | 622 | -133 | -17.6% |
| Asheboro City Schools | 4,547 | 4,418 | -129 | -2.8% |
| Caswell County Schools | 2,346 | 2,217 | -129 | -5.5% |
| Halifax County Schools | 2,180 | 2,052 | -128 | -5.9% |
| Gates County Schools | 1,581 | 1,456 | -125 | -7.9% |
| Ashe County Schools | 2,931 | 2,813 | -118 | -4.0% |
| Currituck County Schools | 4,195 | 4,078 | -117 | -2.8% |
| Asheville City Schools | 4,303 | 4,188 | -115 | -2.7% |
| Madison County Schools | 2,247 | 2,139 | -108 | -4.8% |
| Clay County Schools | 1,278 | 1,172 | -106 | -8.3% |
| Stanly County Schools | 8,310 | 8,206 | -104 | -1.3% |
| Yadkin County Schools | 5,062 | 4,959 | -103 | -2.0% |
| Camden County Schools | 1,859 | 1,758 | -101 | -5.4% |
| Lexington City Schools | 3,050 | 2,962 | -88 | -2.9% |
| Pamlico County Schools | 1,246 | 1,160 | -86 | -6.9% |
| Alleghany County Schools | 1,374 | 1,293 | -81 | -5.9% |
| Kannapolis City Schools | 5,391 | 5,311 | -80 | -1.5% |
| Swain County Schools | 1,924 | 1,845 | -79 | -4.1% |
| Jones County Schools | 1,023 | 950 | -73 | -7.1% |
| Graham County Schools | 1,133 | 1,062 | -71 | -6.3% |
| Avery County Schools | 1,890 | 1,821 | -69 | -3.7% |
| Jackson County Public Schools | 3,586 | 3,517 | -69 | -1.9% |
| Mitchell County Schools | 1,806 | 1,738 | -68 | -3.8% |
| Mooresville Graded School District | 5,997 | 5,931 | -66 | -1.1% |
| Hertford County Schools | 2,633 | 2,571 | -62 | -2.4% |
| Edenton-Chowan Schools | 1,877 | 1,818 | -59 | -3.1% |
| Perquimans County Schools | 1,625 | 1,566 | -59 | -3.6% |
| Warren County Schools | 1,780 | 1,721 | -59 | -3.3% |
| Person County Schools | 4,314 | 4,258 | -56 | -1.3% |
| Clinton City Schools | 2,946 | 2,891 | -55 | -1.9% |
| Tyrrell County Schools | 587 | 541 | -46 | -7.8% |
| Polk County Schools | 2,099 | 2,068 | -31 | -1.5% |
| Hyde County Schools | 536 | 514 | -22 | -4.1% |
| Innovative School District | 214 | 209 | -5 | -2.3% |
| Elkin City Schools | 1,198 | 1,216 | 18 | 1.5% |
| Mount Airy City Schools | 1,602 | 1,643 | 41 | 2.6% |
The largest ADM decline was in Charlotte-Mecklenburg Schools (-8,055), followed by Wake County Schools (-4,234), Rowan-Salisbury Schools (-3,292), Winston-Salem/Forsyth County Schools (-3,246), and Guilford County Schools (-2,887).
Statewide enrollments are down for all grade levels except for grade 10. Enrollment declines were most heavily concentrated in kindergarten (14,282 fewer students or -13.6%), followed by 5th grade (8,428 fewer students or -7.5%) and 11th grade (7,859 fewer students or -7.3%).
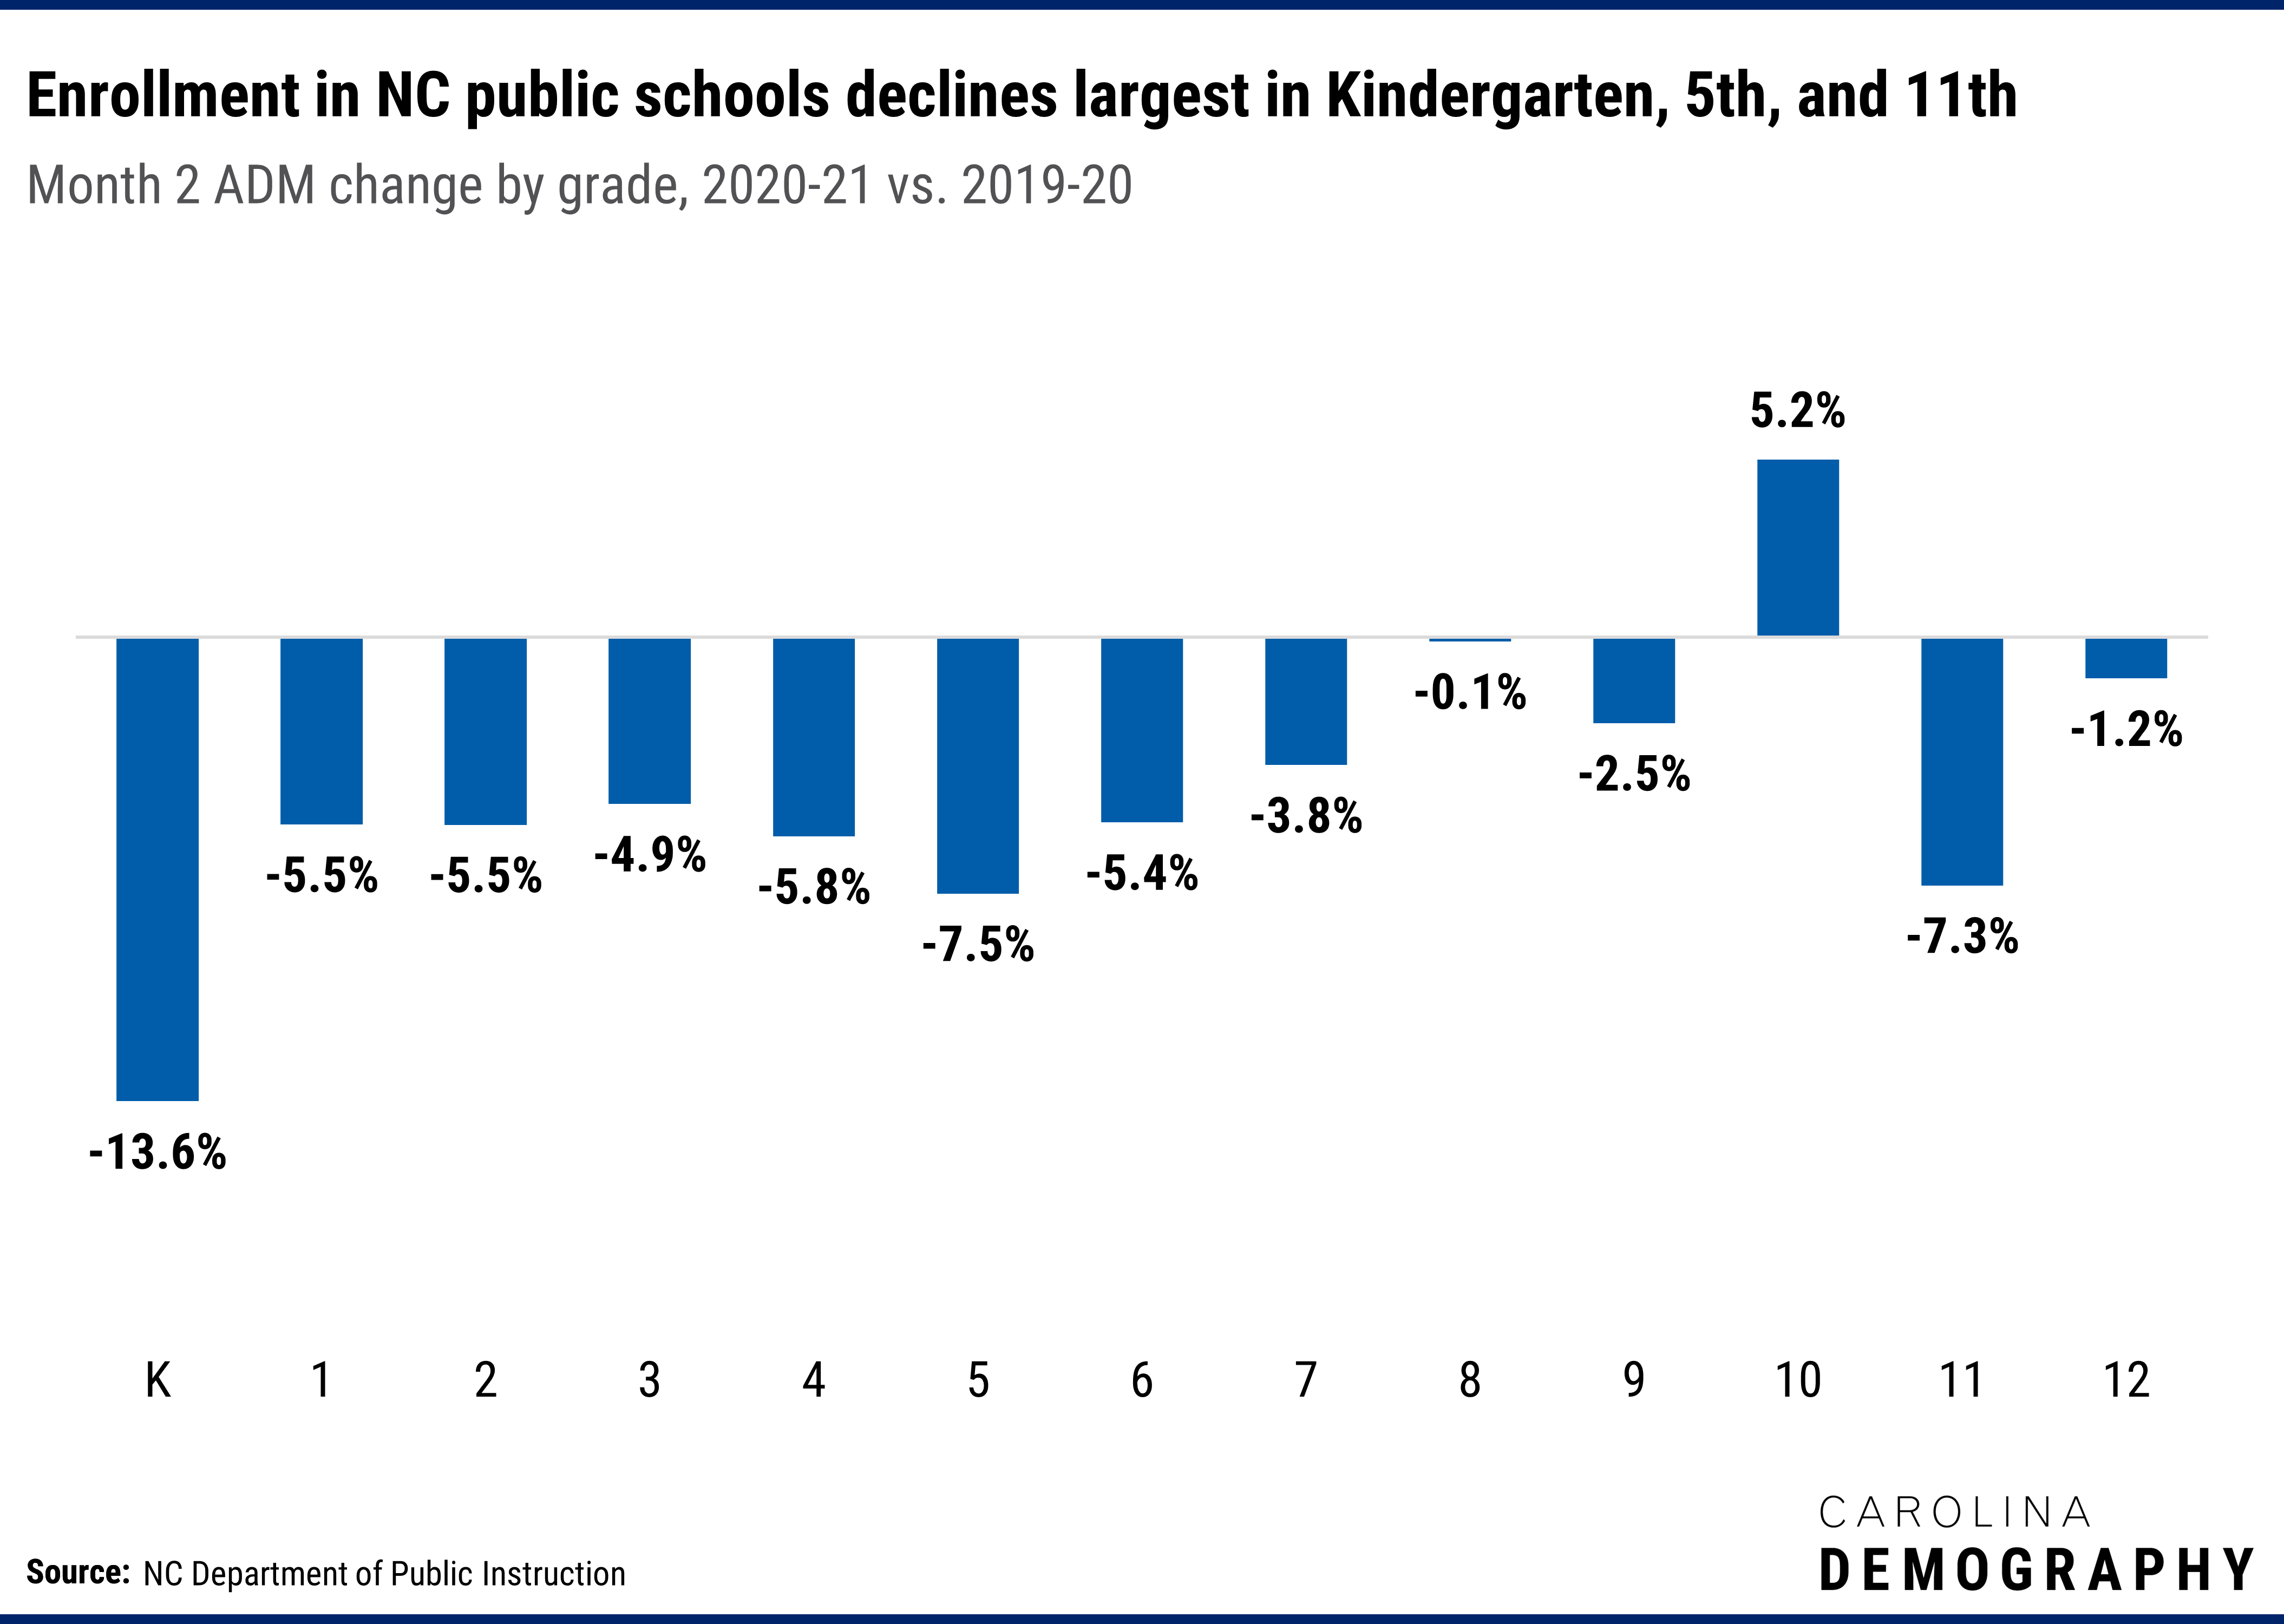
Eighth grade enrollments marked the smallest decline (140 fewer students or -0.1%) while grade 10 enrollments increased by 5,580 or 5.2%. This increase is in part because the 9th grade class in 2019-20 was much larger than the 10th grade class in that year (123K vs. 107K).
Statewide, there were 63,000 fewer students enrolled in public schools in fall 2020 compared to the prior year. While charter school enrollments increased by 8,088 over this period, this leaves more than 50,000 students missing. Some of these students may be in home schools, as fears of the coronavirus combined with the challenges of navigating virtual schooling led some families to choose home schooling as the “easier” option. Other parents may be prioritizing schooling opportunities that offer in-person education by sending their children to private schools. And some students are missing from formal education entirely. We will not know the magnitude of either home school or private school shifts until July 2021, when the 2020-21 data are released from the Division of Non-Public Education at the NC Department of Administration.
Need help understanding population change and its impacts on your community or business? Carolina Demography offers demographic research tailored to your needs.
Contact us today for a free initial consultation.
Contact UsCategories: Education

The Center for Women’s Health Research (CWHR) at the University of North Carolina School of Medicine released the 12th edition of our North Carolina Women’s Health Report Card on May 9, 2022. This document is a progress report on the…

Dr. Krista Perreira is a health economist who studies disparities in health, education, and economic well-being. In collaboration with the Urban Institute, she recently co-led a study funded by the Kate B. Reynolds Foundation to study barriers to access to…

Our material helped the NC Local News Lab Fund better understand and then prioritize their funding to better serve existing and future grant recipients in North Carolina. The North Carolina Local News Lab Fund was established in 2017 to strengthen…
Your support is critical to our mission of measuring, understanding, and predicting population change and its impact. Donate to Carolina Demography today.