
This is the second post in a three-part series previewing redistricting in North Carolina. Other posts provide an overview of redistricting and a preview of what redistricting means for NC’s Senate.
Typically, redistricting starts in April, but the data delays because of Covid-19 pushed back the redistricting data release to August. Redistricting data from the 2020 census will be released on Aug. 12 at 1 p.m. ET. The redistricting files are expected to be uploaded to the Census Bureau’s FTP site.
When that happens, North Carolina legislators will begin the process of redrawing the state’s 14 Congressional districts, 50 state senate districts, and 120 state house districts.
In North Carolina, the redistricting process for the General Assembly is now partially determined by an algorithm that helps to ensure that districts align with county boundaries as much as possible. During the early summer of 2021, we worked with a team of researchers from across the state to understand the potential impacts of population change on state-level redistricting. (Learn more about the team and our approach.) In this post, we break down what might happen in North Carolina’s House.
Remember! The data presented here are based on estimates of population change over the decade based on trends in births, deaths, and migration. These estimates have a margin of error and are not the same as the 2020 Census. We are using this data to give us insights into what we might expect when the first local Census results are released in mid-August.
There are 120 seats in North Carolina’s House.
The ideal district size is equal to the state’s resident population (10,439,388) divided by 120 or 86,995. During the redistricting process, the population of a district can range within 5% of this ideal size, meaning districts can range from 82,645 to 91,345.
We evaluated the legislative county clusters identified under the 2010 Census and under four sets of estimates for the 2020 population of each county (full methodology). In total, the four sets of estimates produced 26 potential county cluster maps.
Estimates of growth over the decade suggest that our two largest counties could pick up representation in the NC House after the release of the 2020 Census:
Wake and Mecklenburg’s gain reflects their large population growth over the decade. For example, as of 2019, the Census Bureau estimated that Mecklenburg had grown by 190K new residents and Wake had gained 211K, more than enough to gain at least one seat in the state house.
There were three county clusters that are not in the current NC House map but emerged in all four of the estimates evaluated:
These changes would have implications for counties that previously were previously clustered with the counties listed above. For example, a Durham-Person cluster would impact Chatham County, which would be sharing portions of a seat with a different county. Potential counties paired with Chatham varied by the estimate evaluated and included Harnett, Lee, Moore, Randolph, and Richmond.
There were seven county clusters that are in the current map (based on 2010 Census) and were also present in all four estimates models. These include the three single district clusters of Lincoln County; Hoke and Scotland counties; and Cherokee, Clay, Graham, and Macon counties. If these clusters remain in the clusters identified with the 2020 Census data, these districts will be unchanged.
Four multi-district clusters on the current map were also present under all estimates evaluated:
While these clusters may be unchanged, the specific district boundaries that are drawn within them will need to be redrawn to account for shifts in population within the county over the decade.
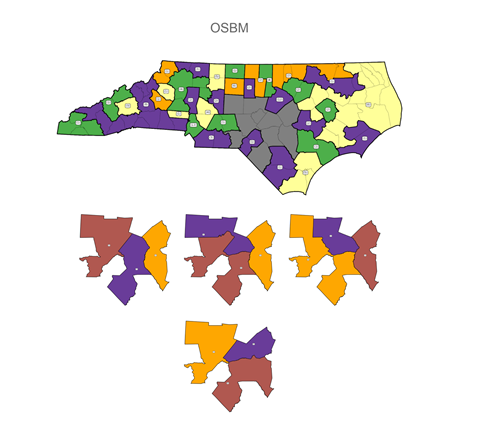
There is a lot of volatility in the clusters produced across the different population estimates that we evaluated as we tried to understand what to expect with the release of the 2020 Census. Notably, in the NC House map, the instability was greatest in areas that have experienced population declines, though not entirely concentrated there. Regions with the greatest instability included the northeast, southeast (Onslow to Sampson/Duplin), the northwest, and the sandhills. For example, the image below highlights the four potential county clusters identified using the 2020 population data from the state demographer at the Office of State Budget and Management.
While these data can help us understand what we might expect when the 2020 Census data is released in the next few weeks, we are still waiting for the official Census numbers. These should be released by August 16, 2021.
This process can be confusing. Even once we have the Census numbers, there may be multiple county clusterings that are identified, meaning that there will be decisions about which counties should be clustered together for the purposes of redistricting. Once the county clusters have been selected, the redistricting process fully begins, as there are often multiple districts within the county clusters. In these instances, there are many potential ways to draw the corresponding lines, and there is less explicit guidance than what exists for identifying potential clusters.
We will be writing a series of posts and explainers about redistricting in the coming days and will disseminate additional information through our newsletter. You can sign up on the top right-hand side of this page.
If you have questions about redistricting, let us know and we will do our best to answer.
August 5: The Census Bureau is holding an informational webinar in advance of the redistricting data release on Thursday, August 5 at 1 p.m. EDT.
August 11: The NC Office of State Budget and Management is hosting a virtual event to discuss how and where to get the data and the legal foundation of redistricting.
Need help understanding population change and its impacts on your community or business? Carolina Demography offers demographic research tailored to your needs.
Contact us today for a free initial consultation.
Contact UsCategories: Census 2020, Elections & Voting, NC in Focus

The Center for Women’s Health Research (CWHR) at the University of North Carolina School of Medicine released the 12th edition of our North Carolina Women’s Health Report Card on May 9, 2022. This document is a progress report on the…

Dr. Krista Perreira is a health economist who studies disparities in health, education, and economic well-being. In collaboration with the Urban Institute, she recently co-led a study funded by the Kate B. Reynolds Foundation to study barriers to access to…

Our material helped the NC Local News Lab Fund better understand and then prioritize their funding to better serve existing and future grant recipients in North Carolina. The North Carolina Local News Lab Fund was established in 2017 to strengthen…
Your support is critical to our mission of measuring, understanding, and predicting population change and its impact. Donate to Carolina Demography today.