
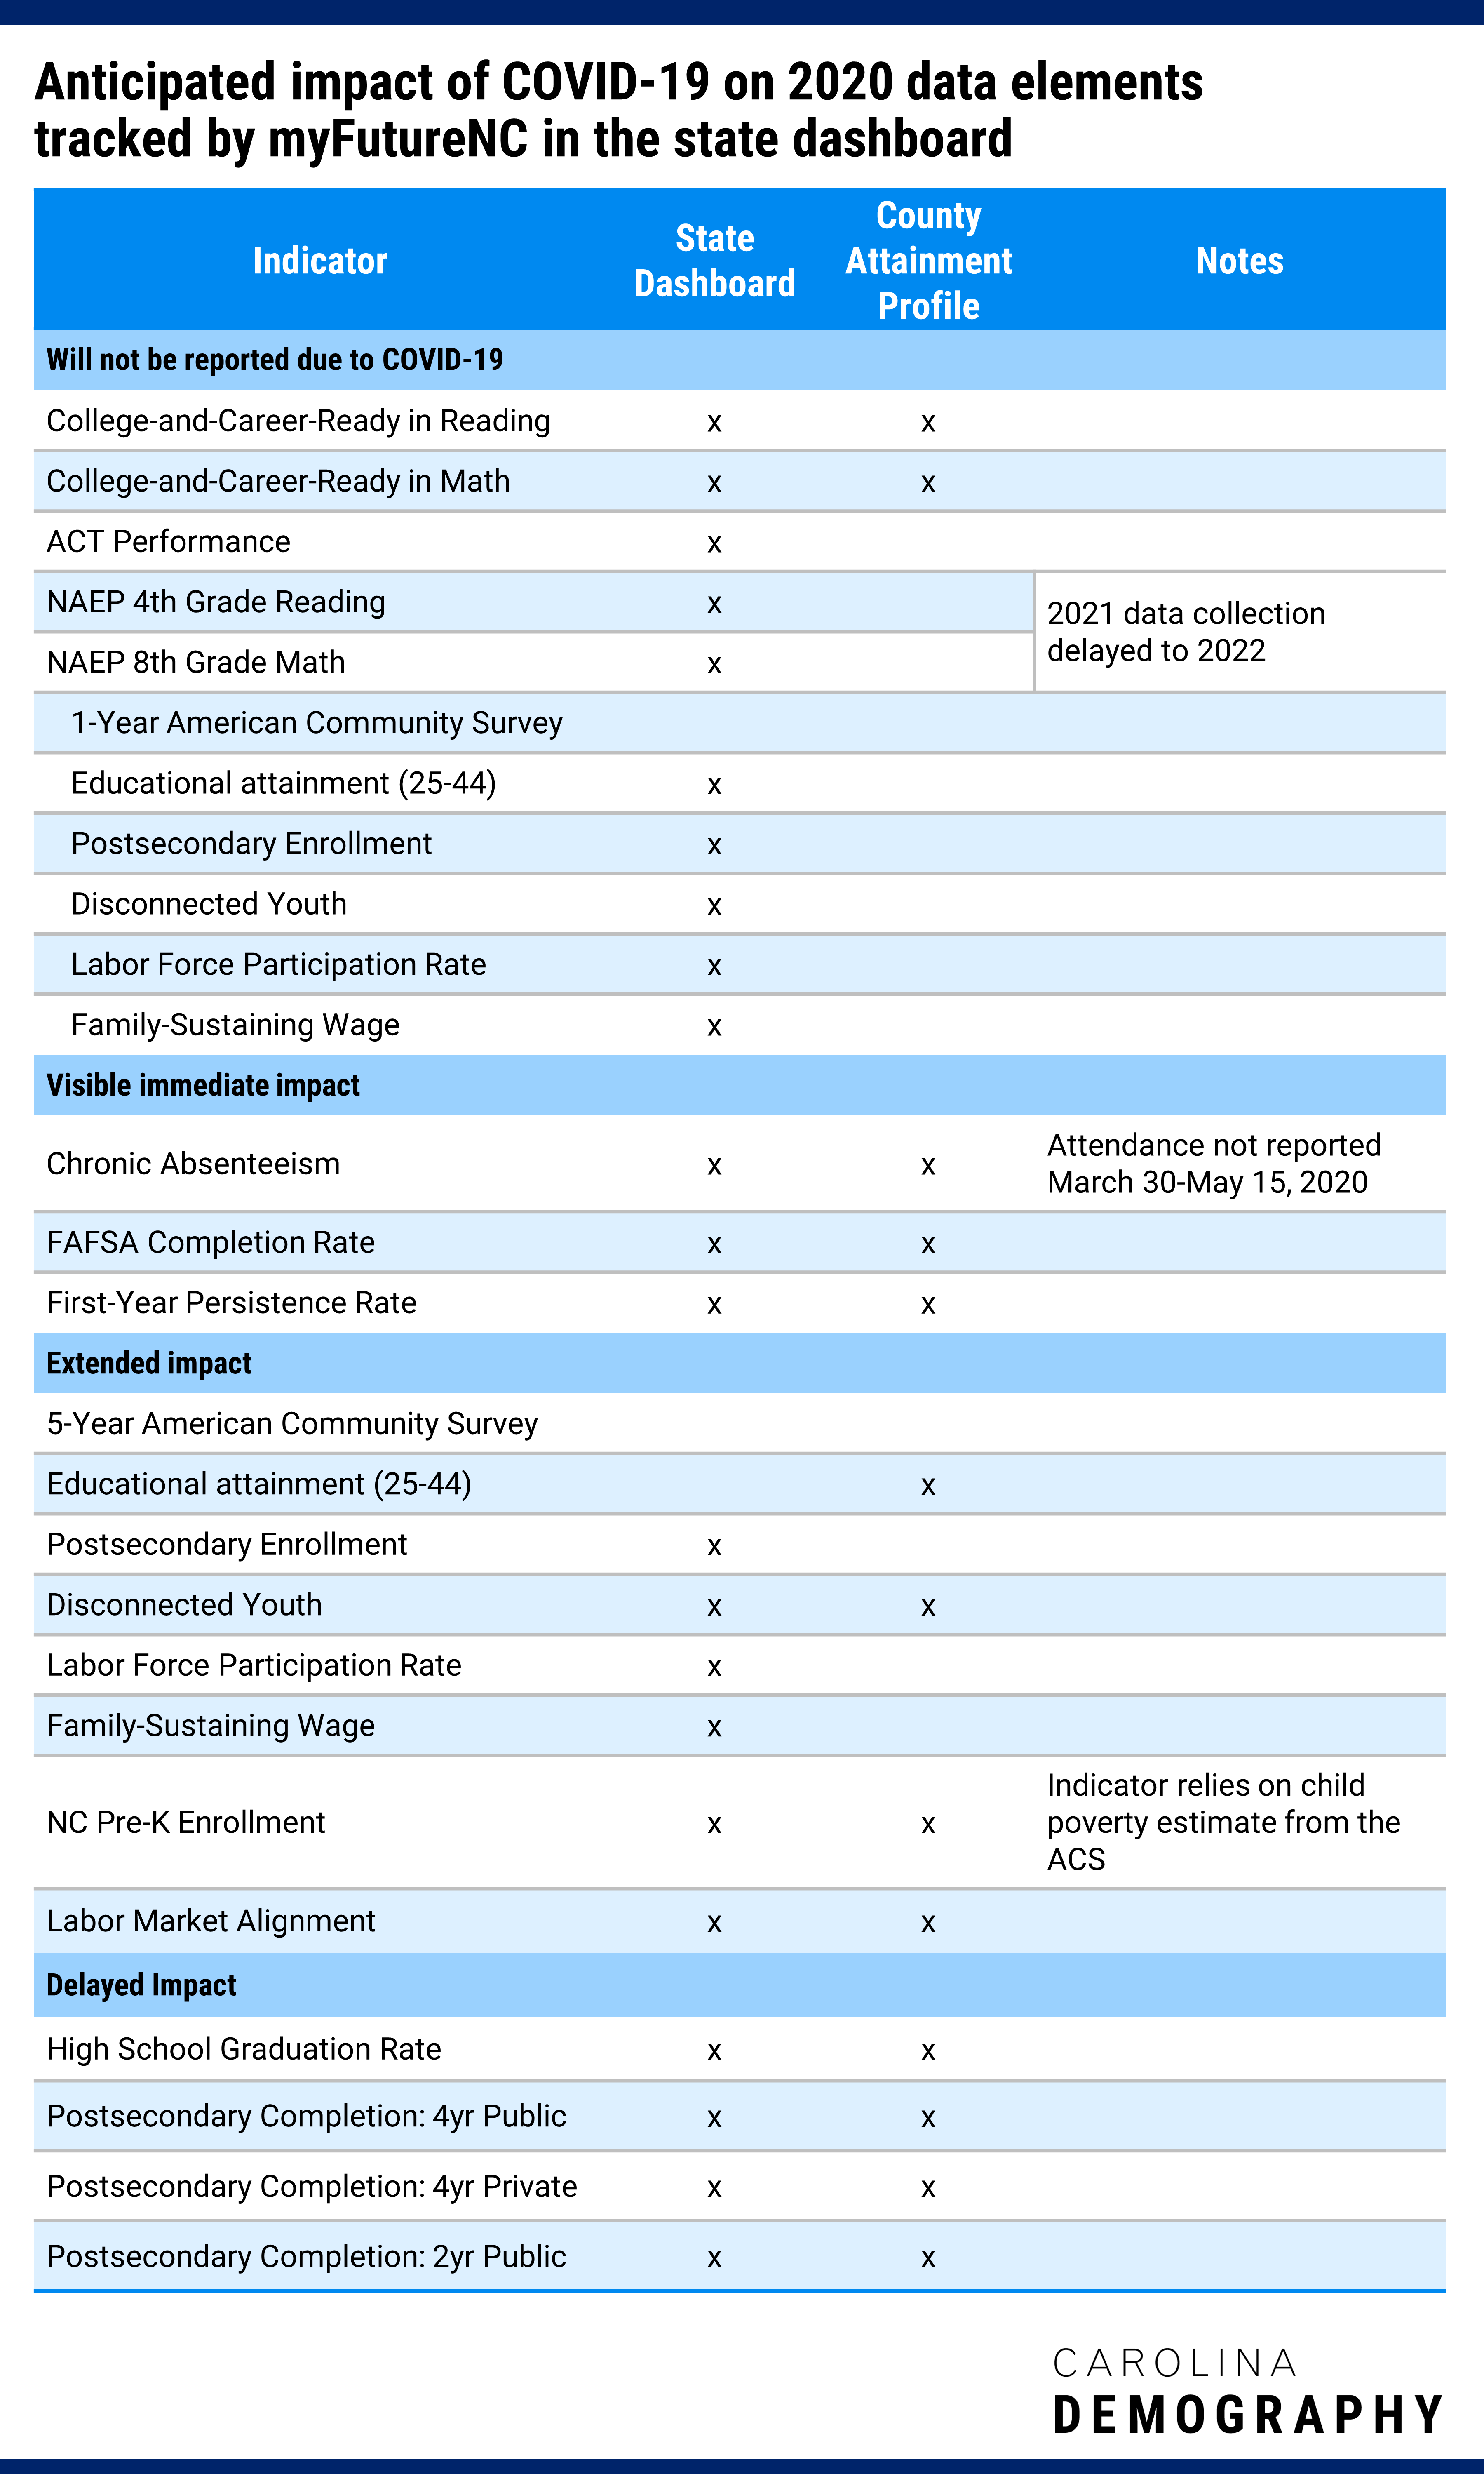
Earlier this year, we documented what we have learned so far about the pandemic’s effect on the educational system in NC. In this post, we detail how we expect data to be impacted across the education continuum, from Pre-K to career, with specific attention to 18 education indicators we monitor through the myFutureNC state dashboard. There are four main ways data can be impacted:
COVID-19 significant disrupted data collection processes. Many of the metrics derived from the NC Department of Public Instruction were not available for 2020 data updates, due to federal testing waivers. Metrics not available include:
Key data on social and economic characteristics was also impacted. The U.S. Census Bureau recently announced that it would not release the 2020 1-Year American Community Survey due to pandemic impacts on data collection. This impacts the state-level data reported in the dashboard for:
State and county data for these metrics may be released under the 5-year American Community Survey estimates (see 3 – Delayed Impact).
Other metrics impacted by COVID-19 include measures derived from the National Assessment of Educational Progress (NAEP), such as math and reading proficiency. NAEP is typically conducted every two years and assessments originally scheduled for 2021 are delayed to 2022.
Indicators calculated with 2019-20 or 2020-21 school year data may differ substantially from other years because of the impacts of Covid-19. Data from the 2019-20 and 2020-21 school year may not be fully comparable to previous or subsequent years.
With the implementation of school closures in spring 2020, schools were no longer mandated to report attendance from March 30 through May 15, 2020. As a result, the chronic absenteeism rate dropped from 15.9% for the 2018-19 school year to 9.3% in the 2019-20 school year. While attendance-taking was reinstated for the 2020-21 school year, the data will not be comparable to prior years due to the challenges of capturing attendance of students across the variety of learning environments (in-person and both synchronous and asynchronous virtual).
Note: No new data on state-by-state levels of chronic absenteeism has been released since 2015-16. All data updates are currently obtained through NC DPI.
Through August 31, 2020, 58% of the high school class of 2020 in North Carolina had completed the FAFSA, down from 60% in 2019.
As of July 16, 2021, 55.5% of 2021 NC high school graduates had completed the FAFSA, above the national rate of 54.3%. This represents 58,822 completed FAFSA applications in North Carolina, which is -4.7% fewer applications than the last academic year. FAFSA completions are down most significantly in:
The school districts with the largest declines in the number of completions compared to last academic year are Montgomery County Schools (-53.7%), Perquimans County Schools (-45.9%), and Northampton County Schools (-43.5%).
Read more:
How is COVID-19 Impacting FAFSA in the Cape Fear Region?
NC First in FAFSA Tracker
Data released in early July 2021 from the National Student Clearinghouse Research Center reported a marked decline in the first-year persistence rate in fall 2020, meaning fewer students who began college in fall 2019 were enrolled in college during fall 2020 compared to prior years. Nationally, the persistence rate decreased from 75.9% to 73.9%. First-year persistence rates also dropped two percentage points in North Carolina, falling to 76.3% from 78.3%.
Other data with visible immediate impact that we are monitoring on the myFutureNC County Attainment Profiles include:
Statewide enrollments were down for all grade levels except grade 10. There were nearly 63,000 fewer students attending North Carolina’s district schools in early 2020-21, with enrollment declines most heavily concentrated in kindergarten, 5th grade, and 11th grade.
The percent of all high schoolers taking at least one AP exam declined from 16.6% during 2018-19 to 15.8% in 2019-20. Among students enrolled in AP classes, 96% took an exam in 2017-18 and 2018-19; this rate declined to 92% in 2019-20. If test-taking rates among AP-enrolled students had been the same as in prior years, an additional 2,650 students would have taken an exam.
Many county indicators, such as the labor force participation rate, disconnected youth, and family-sustaining wage rate, are drawn from the 5-Year American Community Survey (ACS). This means that there are five years of data used in each year’s update: 2020 data will first be included in the 2016-2020 5-Year ACS scheduled for release in December 2021 through the 2020-2024 5-Year ACS scheduled for release in December 2025. This directly impacts the urban/rural details provided on the state dashboard for the following indicators:
Other data indicators with an extended impact of 2020 in the underlying data include:
There are two potential impacts of COVID-19 on NC Pre-K enrollment rates:
We are interested to see how unemployment and the stimulus may affect the number of children eligible for NC Pre-K, but do not yet have the data to fully evaluate the impact these factors.
Labor market alignment is calculated by NC Commerce by examining the last three years of degrees awarded by postsecondary institutions in North Carolina and the last three years of job openings. The current data is based on 2017-2019 and we do not yet have the data to fully evaluate the impact of 2020 on this metric.
Some indicators reflect processes that occur over a multi-year time span and the impacts of COVID-19 will not be readily captured in a single year of data. For example, postsecondary completion rates are measured six years after students enter postsecondary; the data for student outcomes for graduation in 2020 reflects the share of students who entered postsecondary in 2014 and graduated by 2020. Similarly, high school graduation rates may also show impacts of COVID-19 for multiple years after the pandemic is “over.”
The national data on high school graduation rates used to make state-to-state comparisons is generally released about two years after the graduation year. We will not be able to evaluate the impact of COVID-19 on state-level high school graduation rates until 2022 or 2023.
There were no clear impacts of COVID-19 on the high school graduation rate for the graduating class of 2020 from North Carolina public schools; graduation rates increased compared to 2019. The first impacts of COVID-19 on high school graduation rates may not be visible until the release of 2020-21 graduation rates in fall 2021.
We will make changes to the myFutureNC dashboard website when new data is available to ensure that the public and policymakers can understand the impacts of COVID-19 on the outcomes monitored by myFutureNC.
Need help understanding population change and its impacts on your community or business? Carolina Demography offers demographic research tailored to your needs.
Contact us today for a free initial consultation.
Contact Us
The Center for Women’s Health Research (CWHR) at the University of North Carolina School of Medicine released the 12th edition of our North Carolina Women’s Health Report Card on May 9, 2022. This document is a progress report on the…

Dr. Krista Perreira is a health economist who studies disparities in health, education, and economic well-being. In collaboration with the Urban Institute, she recently co-led a study funded by the Kate B. Reynolds Foundation to study barriers to access to…

Our material helped the NC Local News Lab Fund better understand and then prioritize their funding to better serve existing and future grant recipients in North Carolina. The North Carolina Local News Lab Fund was established in 2017 to strengthen…
Your support is critical to our mission of measuring, understanding, and predicting population change and its impact. Donate to Carolina Demography today.