We recently received a question from a reporter in North Carolina asking how to compare 2010 Census redistricting data to 2020 Census redistricting data when it is released on Thursday, August 12.
This is a great question, and it can be localized. Here’s our guide on how to find the data, analyze the data, and what questions you can ask. For more great information, check out Tyler Duke’s GitHub containing a collection of data, methodology and other information related to the release of the 2020 Census redistricting file. (Tyler is a data journalist at the News & Observer and well-versed in Census data; his GitHub is a veritable treasure trove of material to explore and use.)
This tutorial steps you through how to do this using R (where possible…bear with me, I’m a slowly-learning Stata convert). In it, we will cover:
File layout details (geographic variables vary from file to file)
Blocks | Counties | Places (Cities, Towns, and CDPs) | Place by County | Townships (Minor Civil Divisions) | VTDs | School Districts
Tracts | Counties | Congressional Districts | State House Districts | State Senate Districts | File Layout
Note: For data not shown here, check out Big Local News (“The 2020 Census Data Co-Op Project”, free with sign up and covers all states) or this GitHub from Tyler Dukes.
The 2020 Census data in pipe-delimited, legacy format will be available for download from the U.S. Census Bureau at 1:00 p.m. EST on Thursday, August 12, 2021. The Bureau has provided detailed information on how to extract data from these files using Microsoft Access, SAS, or R (see “Legacy Format Support Materials”).
The guidance here uses a modified version of the R statistical software import scripts provided by the Bureau (packages: dplyr). This works with the complete set of redistricting data and will subset a key set of variables (race and ethnicity for the total population and for population 18+, housing units and occupancy, and group quarters) for census blocks, census tracts, places, and counties. To use this file:
Additional resources:
The Census Bureau’s congressional and state legislative district boundaries in the 2020 Census redistricting data release are the 116th congressional and the 2018 state legislative districts. For North Carolina, this means that they do not reflect the 2019 redistricting plans and North Carolina data users cannot rely on the aggregate data in the P.L. 94-171 files or the Name Look-Up Tables provided by the Bureau.
There are two methods that we could use to get the 2020 data into the current NC redistricting shapes:
I used the backcasting method (option 2) to develop files for North Carolina’s congressional districts, state House, and state Senate (see my work or compare the population totals from the two approaches).
You can download historical redistricting data files directly from the U.S. Census Bureau (2010 and 2000), but the best resource for historical Census data is the National Historical Geographic Information System (NHGIS). NHGIS maintains easy-to-access summary tables and boundary files for all levels of U.S. Census geography and is free with signup. You can access historical files using the following steps:
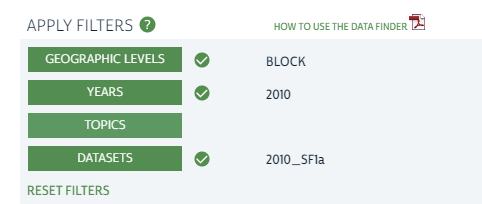
| 2000 (SF1b) | 2010 (SF1a) |
| NP001A. Total Population | NP001A. Total Population |
| NP005A. Total Population 18 Years and Over | NP005A. Total Population 18 Years and Over |
| NP008A. Population by Hispanic or Latino and Not Hispanic or Latino by Race | NP008A. Population by Hispanic or Latino and Not Hispanic or Latino by Race |
| NP027H. Population in Group Quarters by Group Quarter Type | NP027H. Population in Group Quarters by Group Quarter Type |
| NH001A. Total Housing Units | NH001A. Total Housing Units |
One of the biggest challenges is that the census geographies like census tracts changes from decade-to-decade. This can make it difficult to compare population changes without additional manipulation. Tyler Dukes has a great write up of how to do this on his Github. The files we are releasing reflect this same approach (TXT file of my Stata code for reweighting 2010 blocks).
This section contains a list of questions we have received from reporters and community members. We’ll be updating this as we do our own analysis and receive and respond to questions, so check back for additional code and resources! (Have a question you’d like to see answered? Let us know at demography@unc.edu).
Recent guidance from the Census Bureau on their Disclosure Avoidance System indicates that smaller geographies, such as blocks, may be “fuzzy” due to privacy protections; they recommend that users interested in small-area population changes analyze census tracts or larger geographies.
We generally use a combination of ArcGIS (paid) to make shapefiles in combination with free visualization tools such as Tableau Public and Data Wrapper. Other free resources, such as R and QGIS, may be alternatives for making shapefiles.
This really depends on what you are interested in (there are a lot!). For example, if you want to understand where we are in 2020:
Alternatively, if looking at 2020 in comparison to 2010:
Need help understanding population change and its impacts on your community or business? Carolina Demography offers demographic research tailored to your needs.
Contact us today for a free initial consultation.
Contact UsCategories: Census 2020, Story Recipe

The Center for Women’s Health Research (CWHR) at the University of North Carolina School of Medicine released the 12th edition of our North Carolina Women’s Health Report Card on May 9, 2022. This document is a progress report on the…

Dr. Krista Perreira is a health economist who studies disparities in health, education, and economic well-being. In collaboration with the Urban Institute, she recently co-led a study funded by the Kate B. Reynolds Foundation to study barriers to access to…

Our material helped the NC Local News Lab Fund better understand and then prioritize their funding to better serve existing and future grant recipients in North Carolina. The North Carolina Local News Lab Fund was established in 2017 to strengthen…
Your support is critical to our mission of measuring, understanding, and predicting population change and its impact. Donate to Carolina Demography today.