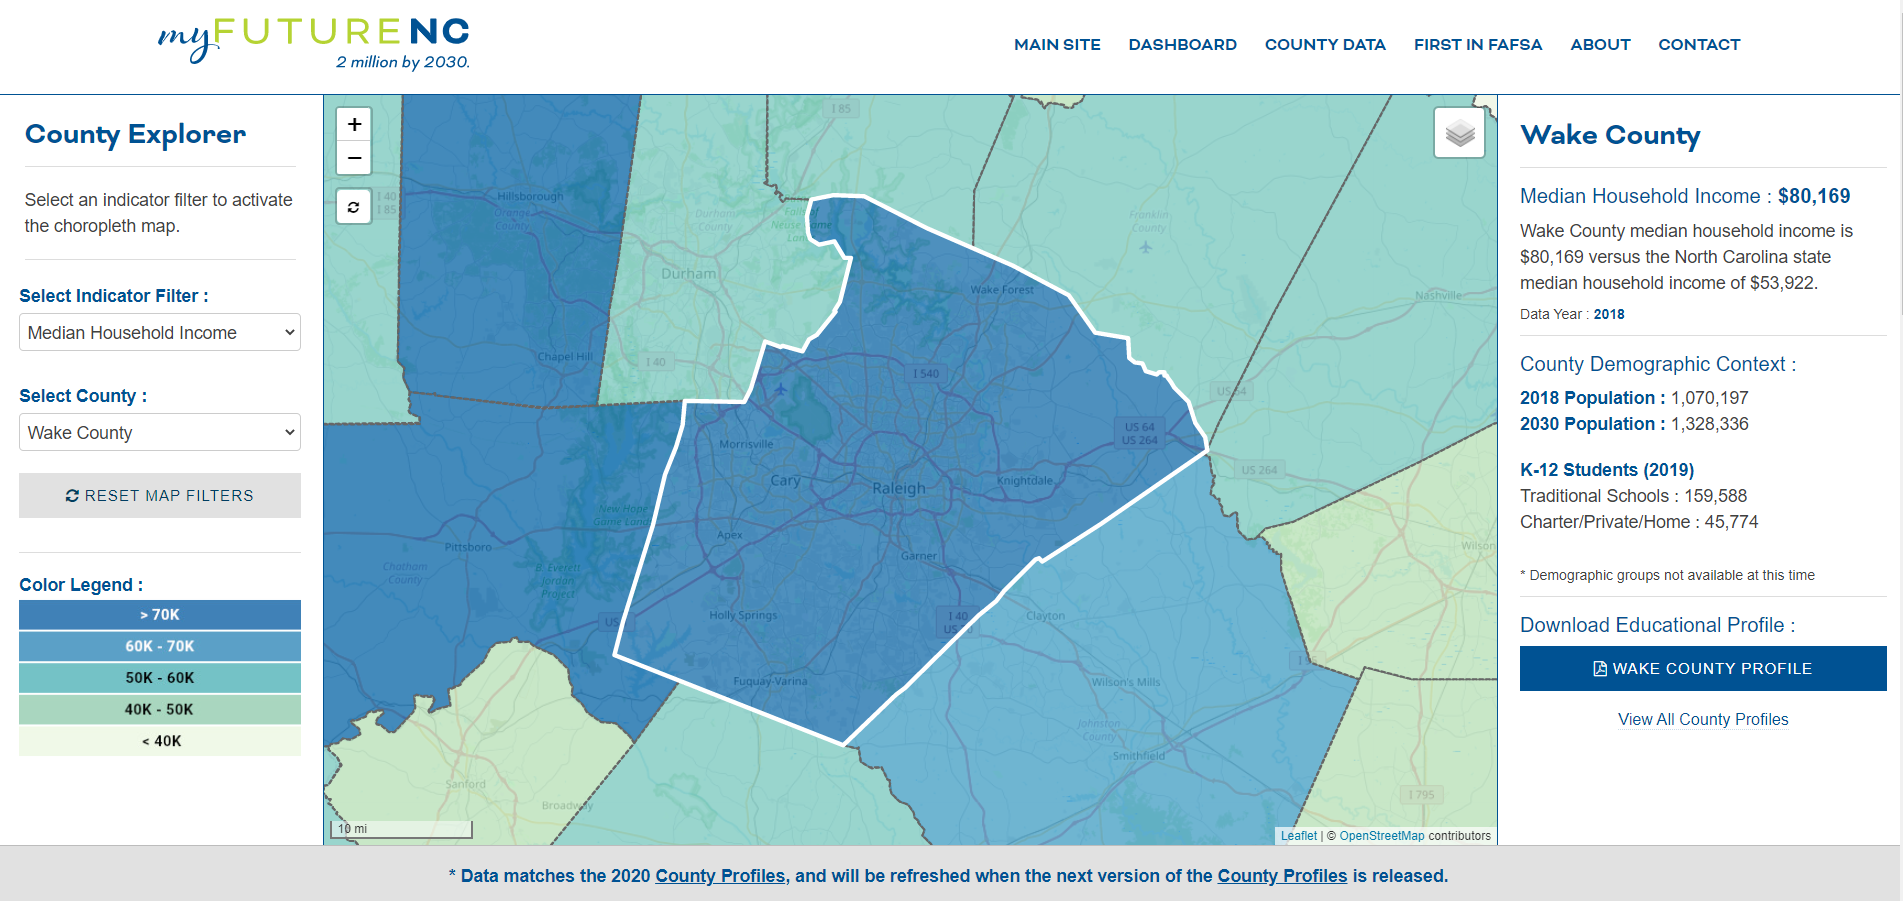
Today we are launching a new tool with myFutureNC to help you visualize educational indicators at the county-level. The County Explorer map tool provides a bird’s eye view of county performance and uses data from the 2020 County Profiles.
To use the County Explorer tool, select an indicator from the drop-down menu in the left sidebar. Information about the county will be displayed in the right side bar, along with a link to the corresponding county profile.
You can select counties by using the drop-down menu in the left sidebar or by selecting a county from the map of North Carolina.
Information available in the County Explorer map tool currently includes outcomes for demographic groups (race/ethnicity, gender, economic status) when that information is available. Future releases will include trends over time.
The County Explorer works best on desktop devices.
Data Available through the County Explorer
Population-level numbers on the county explorer reflect the data used in the 2020 county-level attainment profiles. Data will be updated and refreshed on the site when the 2021/22 county attainment profiles are released.
Indicator choropleth maps and county information that can be selected from the indicator filter drop-down menu include:
Need help understanding population change and its impacts on your community or business? Carolina Demography offers demographic research tailored to your needs.
Contact us today for a free initial consultation.
Contact UsCategories: Education

The Center for Women’s Health Research (CWHR) at the University of North Carolina School of Medicine released the 12th edition of our North Carolina Women’s Health Report Card on May 9, 2022. This document is a progress report on the…

Dr. Krista Perreira is a health economist who studies disparities in health, education, and economic well-being. In collaboration with the Urban Institute, she recently co-led a study funded by the Kate B. Reynolds Foundation to study barriers to access to…

Our material helped the NC Local News Lab Fund better understand and then prioritize their funding to better serve existing and future grant recipients in North Carolina. The North Carolina Local News Lab Fund was established in 2017 to strengthen…
Your support is critical to our mission of measuring, understanding, and predicting population change and its impact. Donate to Carolina Demography today.