The Criminal Justice Innovation Lab (“Lab”) at UNC’s School of Government recently released a Measuring Justice Dashboard. The dashboard visualizes millions of North Carolina criminal justice records to help stakeholders understand state and local systems, see where they are doing well, and spot areas that may need attention. We spoke with Jessica Smith, Lab Director and W.R. Kenan Jr. Distinguished Professor of Public Law and Government, about the dashboard and how it was built.
In the U.S. and in North Carolina, it can be challenging to get basic information about how state and local criminal justice systems function. Recent North Carolina legislation directed the state Department of Information Technology to study and report back to the legislature on the issue.
Key stakeholders – people like judges, prosecutors, public defenders, and law enforcement officials – spoke to us about these data gaps. They told us that lack of data makes it hard to identify areas that need attention and to measure the impact of their efforts to improve the system. They raised questions such as:
Because one of our core values is responsiveness, I knew we had to do something to address this issue. The Dashboard is just one of our responses.
Reports issued by Measure for Justice and Arnold Ventures detail efforts to modernize data related to the criminal justice system.
The data comes from our North Carolina Criminal Information System. That’s a digital database of state court system criminal records from 2014 to present—millions and millions of records. We’re planning to release more key metrics in the coming months.
The Lab brings together a broad range of stakeholders to learn about criminal justice problems, implement innovative consensus solutions, and measure the impact of their efforts. We aim to promote a fair and effective criminal justice system, public safety, and economic prosperity through an evidence-based approach to criminal justice policy.
All of our work is team-based and this project was no exception. Developing the Dashboard was a collaborative effort across UNC. The Odum Institute helped us build and maintain the database. (A big thank you to Odum’s Jonathan Crabtree and Matthew Dunlap, who did amazing work on our database!) Lab Post-Doctoral Fellow Andre Assumpcao created all the data visualizations and coded the raw database data into the amazing graphs, figures and tools that animate the Dashboard. Other members of the team include: School Legal Research Associate Christopher Tyner, who does core work coding criminal offenses; Lab Project Manager Ethan Rex, who provides additional data support; and Carolina Demography’s Rebecca Tippett, who provided important advice regarding our methodology for analyzing demographic categories.
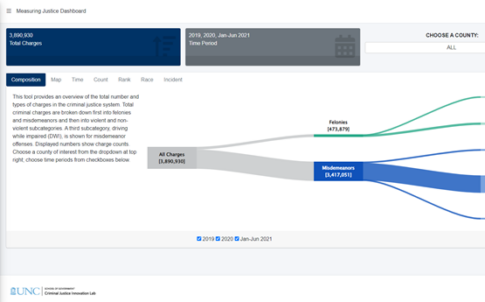
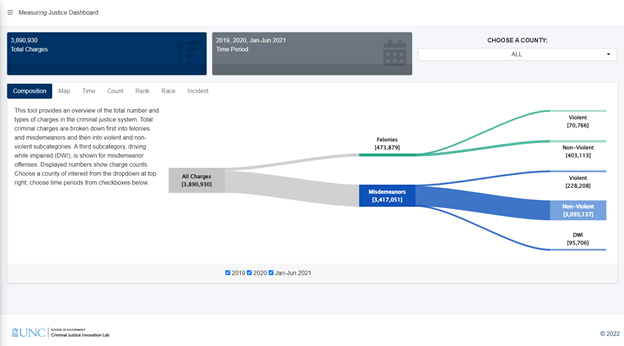
How much space do we have? Honestly, almost everything surprised me for the simple reason that we’ve never seen these metrics before. But if you’re asking about “eye popping” data, take a look at the Composition Tab under the Criminal Charging metric. In one clear visualization (below) you can see—at a glance—that the state’s criminal justice system is overwhelmingly a non-violent misdemeanor system. This single metric is changing the way people think about the system.
It’s often said that you can’t fix what you can’t measure. Many people we work with want to improve the justice system. They are interested in improving public safety, more efficiently using taxpayer resources, and promoting fairness.
To help them do that we’re building a toolbox of evidence-based resources. We hope the Dashboard will become an important tool in that toolbox.
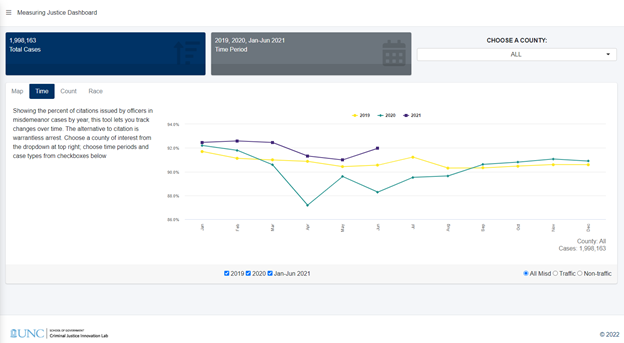
Here’s an example. Suppose a county is seeking to promote least harm resolutions by law enforcement officers and wants to promote officers’ use of citations instead of warrantless arrests. Looking at the Dashboard’s Citation v. Arrest metric, local stakeholders can see their county’s current citation rate and how it compares all other North Carolina counties; they can see how their citation rate has changed over time (below); they can put changes in the citation rate in context by looking at counts of citations and arrests; and they can examine difference in arrest rates by race. Put simply, we’ve equipped them with a ton of information to assess both whether they want to make any changes and if so, what impact those changes might have.
Yes, we have a lot more criminal justice metrics coming. These include things like non-appearance rates; pretrial criminal activity rates; data about pending case loads and dispositions; information about how cases are resolved (e.g., plea versus trial); and sentencing data.
But in addition to criminal justice system metrics, we’re looking to add person-level criminal-adjacent data such as eviction and employment information, so that we can better understand the full impact of the criminal justice system.
No, for the simple reason that there isn’t really anything else available on these data points.
Since we launched the Dashboard in late October 2021, we’ve tracked more than 230 hours of user activity. Thus, even though it’s been a bit of a soft launch, we know that people are engaging with the Dashboard. Additionally, we’ve been asked to present the Dashboard to various state-level entities that are examining the justice system, including the Task Force on Racial Equity in Criminal Justice and the North Carolina Courts Commission.
We’re also using Dashboard data and visualizations in all of our engaged projects with local stakeholders. We currently are supporting projects across North Carolina to improve criminal justice systems. In these projects, we help diverse stakeholders like judges, prosecutors, law enforcement leaders, and public defenders better understand and improve state and local justice systems. The Dashboard gives us a powerful evidence-based tool to bring to these projects and inform stakeholders’ efforts. We’re excited to build out the Dashboard in the coming months and we welcome suggestions on how we can make it better.
Need help understanding population change and its impacts on your community or business? Carolina Demography offers demographic research tailored to your needs.
Contact us today for a free initial consultation.
Contact UsCategories: NC in Focus

The Center for Women’s Health Research (CWHR) at the University of North Carolina School of Medicine released the 12th edition of our North Carolina Women’s Health Report Card on May 9, 2022. This document is a progress report on the…

Dr. Krista Perreira is a health economist who studies disparities in health, education, and economic well-being. In collaboration with the Urban Institute, she recently co-led a study funded by the Kate B. Reynolds Foundation to study barriers to access to…

Our material helped the NC Local News Lab Fund better understand and then prioritize their funding to better serve existing and future grant recipients in North Carolina. The North Carolina Local News Lab Fund was established in 2017 to strengthen…
Your support is critical to our mission of measuring, understanding, and predicting population change and its impact. Donate to Carolina Demography today.