This is part of our series looking at NC’s registered voters. Other stories include an in-depth look at NC’s Democrat voters and an in-depth look at NC’s unaffiliated voters. This is an update of our story from August 2020.
As of October 22nd, 2022, North Carolina had 7.4 million registered voters. Of these, 2.2 million or 30% were registered as a Republican.
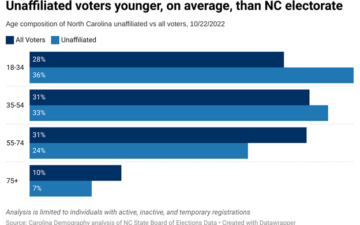
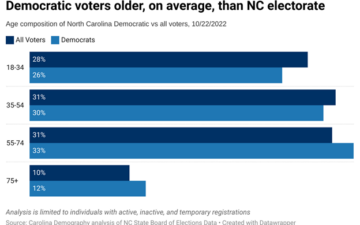
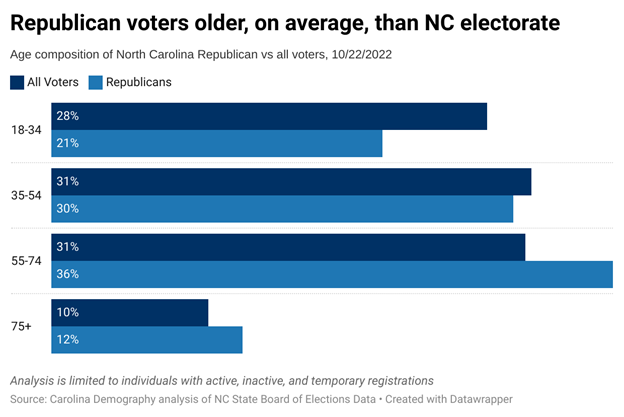
Younger voters are the least likely to register as Republican, reflecting their higher affinity for registering unaffiliated. Just 23% of voters ages 18-34 are registered Republican compared to 29% of 35–54-year-olds, 36% of 55-74 year-olds, and 37% of voters ages 75 and older. As a result, older adults, especially those ages 55-74, comprise a larger share of Republican voters than the overall electorate: 41% of all voters are ages 55+ compared to 49% of registered Republican voters.
Reflecting this age structure, 13% of North Carolina Republican voters first registered to vote in the state before 1990; 13% registered in the 1990s; 19% in the 2000s; and 55% in 2010 or later.
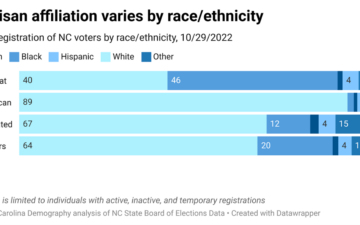
North Carolina’s registered Republicans are overwhelmingly white. Eighty-nine percent of Republican voters are white compared to 64% of the electorate overall.
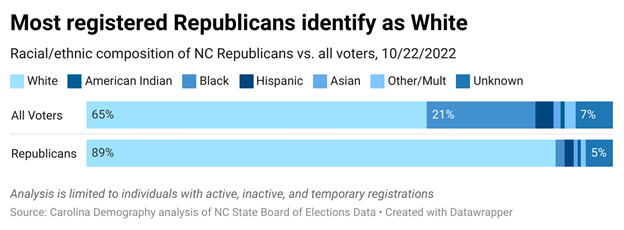
White voters are significantly more likely to register as Republican (41%) compared to other groups. Twenty-one percent of American Indian voters, 17% of Asian voters, 15% of Hispanic voters, and 2% of black voters are registered Republican in North Carolina.
North Carolina voters born in a Midwestern state are generally the most likely to be registered as Republican. Forty-one percent of West Virginia-born individuals are registered Republican, followed by South Dakota (39%), Kentucky (38%), Oklahoma (36%), Indiana (36%), and Nebraska (35%).
Just over 931,000 Republican voters—51% of the state’s Republican voter population—were born in North Carolina. New York (103K), Virginia (71K), Pennsylvania (61K), and Florida (52K) were the next most common birth places. Eighteen percent of Republican voters (397K) provided no information on place of birth.
Across North Carolina’s 100 counties, the county share of Republican voters varies widely, reflecting county differences in composition by age, race/ethnicity, and place of birth. Voters in western counties are generally more likely to register Republican while those in northeastern counties are least likely to register as Republican.
Fifty-eight percent of active voters in Mitchell County were registered Republican, the highest rate statewide. (Mitchell also had the lowest rate of registered Democratic voters.) Over half of registered voters were registered Republican in six other counties: Avery, Yadkin, Wilkes, Randolph, Davie, and Stokes.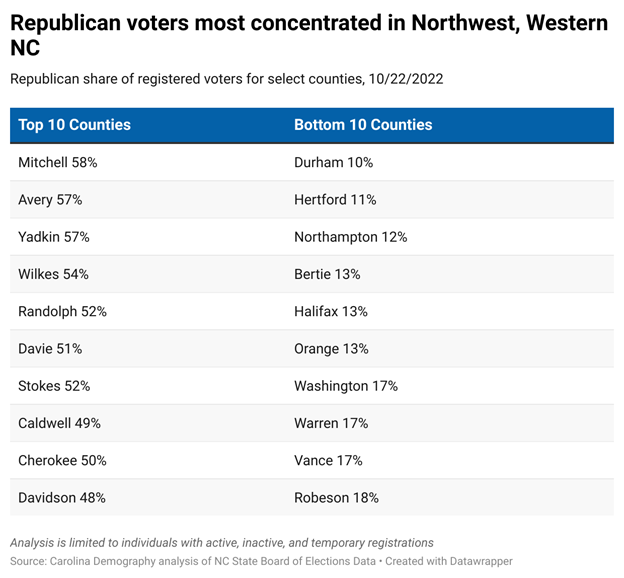
In contrast, less than one in nine voters is registered Republican in Hertford, Northampton, Durham, and Bertie counties.
Note: analysis presented is of the 10/22/2022 voter registration file from NC’s State Board of Elections. Analysis is limited to individuals who are active, inactive, or temporary registered voters. Voters with reported birth age of 116 years or older were excluded from the age analysis. Voters with registration dates prior to 1930 were excluded from the registration date analysis.
Your support is critical to our mission of measuring, understanding, and predicting population change and its impact. Donate to Carolina Demography today.