This is part of our series looking at NC’s registered voters. Other stories include an in-depth look at NC’s Republican voters and an in-depth look at NC’s Democratic voters. This is an update of our 2020 piece.
As of October 22nd, 2022, North Carolina had 7.4 million registered voters. Of these, 2.6 million or 35.5% were registered unaffiliated. This post examines the characteristics of NC’s unaffiliated voters.
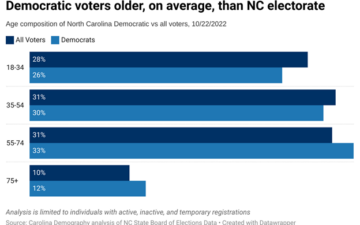
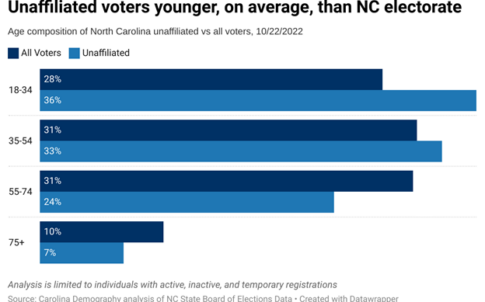
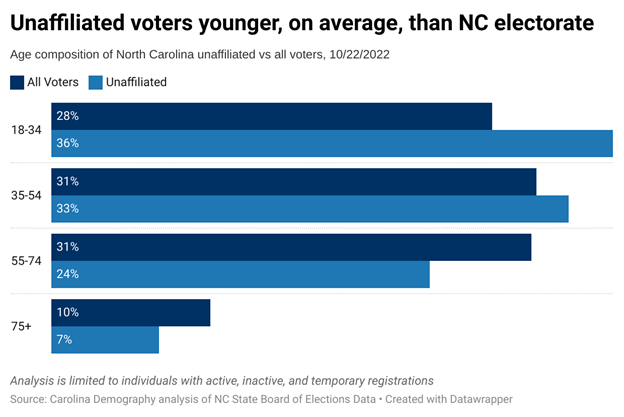
Younger voters are the most likely to register as unaffiliated. Forty-five percent of voters ages 18-34 are registered unaffiliated compared to 38% of voters ages 35-54, 28% of voters ages 55-74, and 24% of voters 75 and older. As a result, younger adults, especially those ages 18-34, comprise a larger share of unaffiliated voters than the overall electorate.
Reflecting this age structure, 5% of North Carolina unaffiliated voters first registered to vote in the state before 1990; 8% registered in the 1990s; 16% in the 2000s; and 71% in 2010 or later.
Compared to the state population overall, white votes are more likely to be unaffiliated than the greater population (67% vs. 65%). Asian and Hispanic voters have an above average share of unaffiliated voters and black voters are a smaller share than their share in North Carolina’s electorate overall.
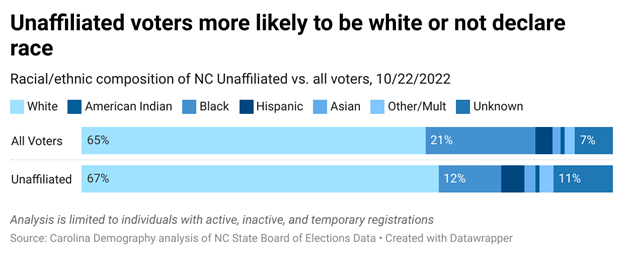
Voters who did not report a race or ethnic identification were the most likely to register as unaffiliated (53%), followed by Asian (52%), multiracial or other race (46%), Hispanic (44%), white (36%), and American Indian (35%) voters. Black voters were the least likely to register as unaffiliated (21%).
North Carolina voters born in a New England state are generally the most likely to be registered as unaffiliated. Fifty percent of voters born in Rhode Island and 49% of New Hampshire and Massachusetts born voters are registered unaffiliated, followed by Vermont (47%).
Just over 860,000 unaffiliated voters—42% of the state’s unaffiliated voter population—were born in North Carolina. New York (149K), Virginia (88K), New Jersey (61K), and Florida (60K) were the next most common birth places.
Across North Carolina’s 100 counties, the county share of unaffiliated voters ranges from about one in six voters to more than two in every five voters. Unlike patterns of Democrat and Republican registrations, there are less clear regional patterns in unaffiliated registrations. The top 10 counties for unaffiliated voters include:
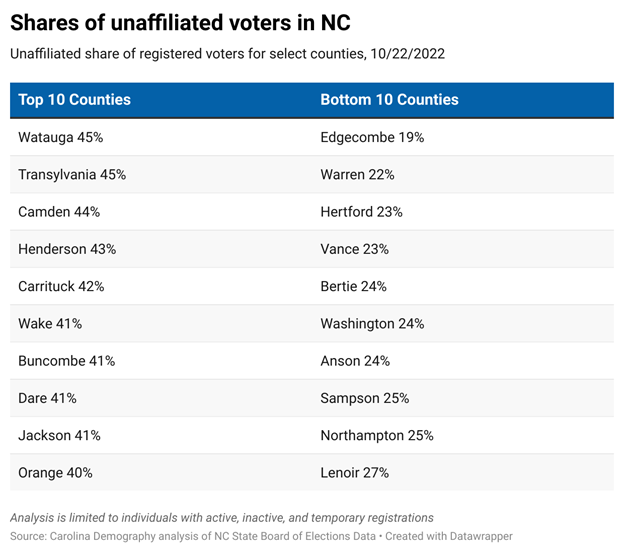
The top counties for unaffiliated voters include college towns (Watauga, Orange) and military communities (Onslow), as well as one of the most populous counties (Wake) and one of the least populous counties (Camden) in the state.
Counties with the lowest rates of unaffiliated voter registrations were in the northeast. Edgecombe County (16%) had the fewest voters registered unaffiliated, followed by Warren (20%), and Hertford (21%).
Note: analysis presented is of the 10/22/2022 voter registration file from NC’s State Board of Elections. Analysis is limited to individuals who are active, inactive, or temporary registered voters. Voters with reported birth age of 116 years or older were excluded from the age analysis. Voters with registration dates prior to 1930 were excluded from the registration date analysis.
Need help understanding population change and its impacts on your community or business? Carolina Demography offers demographic research tailored to your needs.
Contact us today for a free initial consultation.
Contact UsCategories: Elections & Voting

The Center for Women’s Health Research (CWHR) at the University of North Carolina School of Medicine released the 12th edition of our North Carolina Women’s Health Report Card on May 9, 2022. This document is a progress report on the…

Dr. Krista Perreira is a health economist who studies disparities in health, education, and economic well-being. In collaboration with the Urban Institute, she recently co-led a study funded by the Kate B. Reynolds Foundation to study barriers to access to…

Our material helped the NC Local News Lab Fund better understand and then prioritize their funding to better serve existing and future grant recipients in North Carolina. The North Carolina Local News Lab Fund was established in 2017 to strengthen…
Your support is critical to our mission of measuring, understanding, and predicting population change and its impact. Donate to Carolina Demography today.