As early voting for the 2022 midterm elections are underway, there have been demographic shifts in North Carolina since the 2020 general elections. With election day coming soon, we’ve broken down the changes by partisan composition and who makes up our newly registered voting population based on voter registration data as of October 29, 2022.
North Carolina has experienced steady population gains since 2020, with net gains masking a larger turnover in the underlying population. For example, North Carolina added more than 65,000 new residents from net migration in 2021, with around 360,000 individuals moving here from another state or country and roughly 290,000 North Carolinians moving out of state. As a result of the COVID-19 pandemic, North Carolina was a major net gainer of residents leaving high-cost, urban areas.
A concrete way to understand the potential impact of demographic change on North Carolina’s electorate is to look at new voting registrations since the 2020 general election. This number includes new residents in the state, individuals who became 18+ or gained citizenship since 2020, and prior residents who are registering to vote for the first time.
According to the NC State Board of Elections, there have been almost 880 thousand voter registration forms filed since the November 3, 2020 general election. These new voters make up 12% of the state’s 7.4 million registered voters.
There has been a marked increase in new voter registrations in anticipation of the 2022 midterms. Between the 2016 and 2018 elections, almost 700,000 new voter registrations were recorded, while 880,000 new voters have registered since election day 2020. These 880,000 new voters, however, are a decrease from the 1.3 million individuals that registered leading up to the 2020 election.
Voter registrations per month for these midterm elections have been regularly outpacing 2018 figures. While the 2020 election saw a large acceleration of voter registrations over the summer, similar trends have not been observed in 2018 or 2022. This difference, however, is likely a function of the racial justice and pandemic related voter registration movements, which proliferated leading up to the 2020 general election.
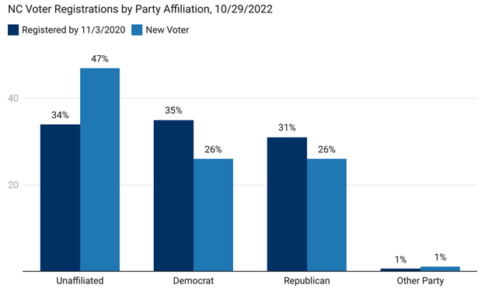
New voter registrations suggest an overall swing away from major parties and towards unaffiliated, with the greatest impact on the Democrat share of registrations. Among new registrants since the 2020 general election:
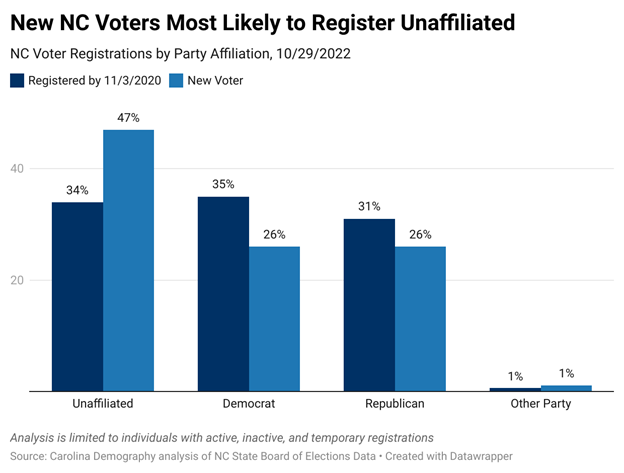
Compared to voters who were registered prior to the 2020 general election, newly registered NC voters were more likely to identify as Hispanic (6% vs. 3%) or Asian (2% vs. 1%). In contrast, newly registered NC voters were less likely to identify as Black (16% vs. 21%) or White (61% vs. 65%).
New voters were also much less likely to report their race or ethnicity on the registration form: 12% of new voters did not provide information on their race or ethnicity compared to 7% of voters registered prior to the 2020 election. This could be potentially due to increased use of the DMV website to register. Voters are also twice as likely now to be report as Hispanic or Latino when registering (6% vs. 3%).
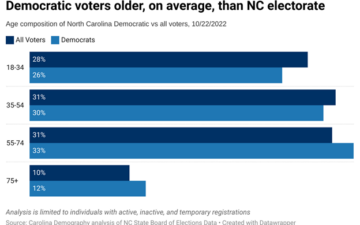
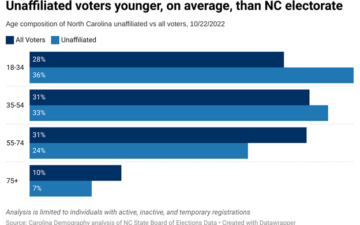
A much larger share of newly registered voters are young voters (53% are under 35 compared to 25% of voters registered for the last election). This is partly because many of these young adults are newly eligible to vote and are registering for the first time, but also because young adults are more likely to move than older adults. Colleges and universities, military bases, and employment opportunities in our state’s metro areas attract many young adults from other states and countries. Among the 608,000 NC registered voters ages 18-24, for example, 30% were registered prior to the 2018 election and 70% have registered since then.
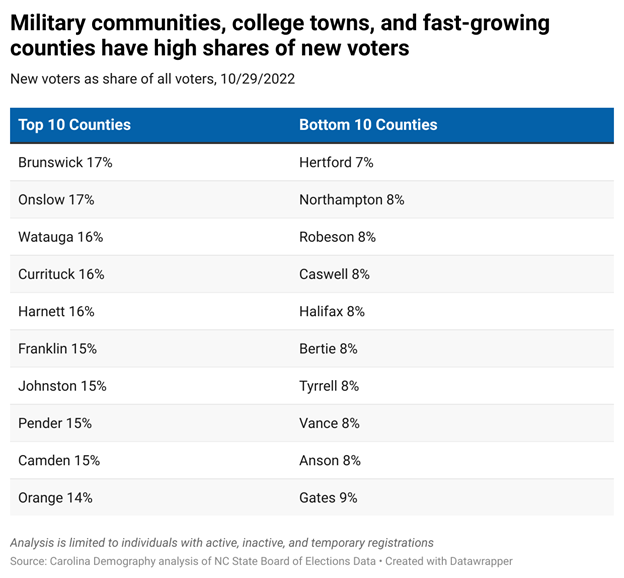
Statewide, 12% of voters have registered since November 3, 2020. In two counties—Onslow (home to Marine Corps base Camp Lejeune) and Brunswick (the fastest growing county in the state), 17% of voters have registered since the 2020 general election.
In contrast, counties where new voters are a relatively smaller share of the local electorate are predominantly located in the northeast, though they also include Anson in the Sandhills and Graham in the west. These counties with the smallest share of new voters have lost population since 2010 according to recent estimates from the U.S. Census Bureau.
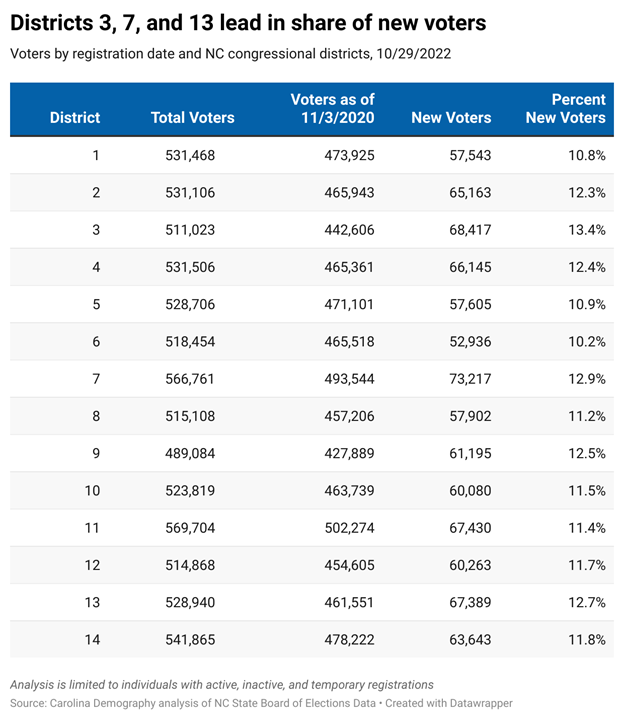
After the 2020 census, North Carolina was awarded an additional congressional seat, bringing the total count to 14. Subject to intense legal scrutiny, a panel of three-former judges were tasked by the Wake County Superior Court to draw nonpartisan, remedial congressional maps, which the North Carolina Supreme Court have approved for the 2022 election. Among North Carolina’s new fourteen congressional districts, the largest number of new voters are:
New voters are the largest share of registered voters (13%) in the 3rd district.
The 6th district (Greensboro up to Virginia border) has the smallest number of new voters (52,936) and the lowest share of new voters (10.2%)
Note: analysis presented is of the 10/29/2022 voter registration file from NC’s State Board of Elections. Analysis is limited to individuals who are active, inactive, or temporary registered voters. Voters with reported birth age of 116 years or older were excluded from the age analysis. Voters with registration dates prior to 1930 were excluded from the registration date analysis.
Need help understanding population change and its impacts on your community or business? Carolina Demography offers demographic research tailored to your needs.
Contact us today for a free initial consultation.
Contact UsCategories: Elections & Voting

The Center for Women’s Health Research (CWHR) at the University of North Carolina School of Medicine released the 12th edition of our North Carolina Women’s Health Report Card on May 9, 2022. This document is a progress report on the…

Dr. Krista Perreira is a health economist who studies disparities in health, education, and economic well-being. In collaboration with the Urban Institute, she recently co-led a study funded by the Kate B. Reynolds Foundation to study barriers to access to…

Our material helped the NC Local News Lab Fund better understand and then prioritize their funding to better serve existing and future grant recipients in North Carolina. The North Carolina Local News Lab Fund was established in 2017 to strengthen…
Your support is critical to our mission of measuring, understanding, and predicting population change and its impact. Donate to Carolina Demography today.