
We are often asked to develop custom presentations for leaders across a variety of sectors who want to know how demographic shifts will affect their industry. We recently gave one such presentation to transportation leaders, who wanted to know how future demographic and industry trends might intersect.
Based at the University of Memphis, the Southeast Transportation Workforce Center (SETWC) helps ensure that there are enough career-ready truck drivers in the Southeast region of the United States. The center identifies education and training gaps, develops partnerships across the transportation and freight sectors, and develops programs to increase diversity in the trucking industry.
SETWC asked Carolina Demography to keynote their annual conference. They requested a presentation on the changing demographics of the Southeast and how those changes would impact the transportation workforce.
Using existing datasets, we created a custom presentation about overall demographic trends in the Southeast, explaining how they compare to national trends. We also provided an overview of the transportation industry and future demographic trends.
The resulting presentation, entitled “Disruptive Demographics? The Changing Southeast and Implications for the Transportation Workforce” was well received. The conference planner wrote afterwards, “Thank you so much for the outstanding presentation last week- I have received numerous compliments regarding the session, and I really appreciate you tailoring it to our needs.”
Southeast Transportation Workforce Center
To develop a custom keynote presentation for a regional conference of transportation planners
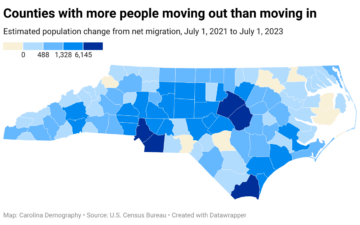
Last week, the U.S (United States). Census Bureau released 2023 county population estimates. These annual estimates tell us how county populations in North Carolina have changed over the course of a year: in this case, between July 1, 2022 and…
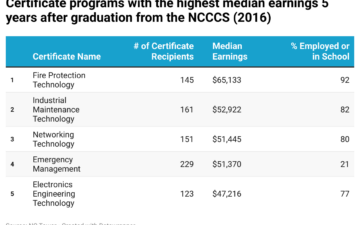
Deciding which educational pathway to pursue is often a daunting decision for a high schooler transitioning to postsecondary education. There are many questions a student must ask. Do I want to pursue a credential or a degree awarding program? What…
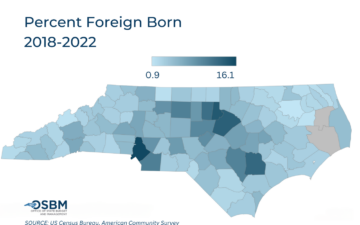
Dr. Michael Cline is the state demographer for North Carolina at the Office of State Budget and Management and has given us permission to re-post his content here. The original version of this piece is here. The foreign-born population in…
Your support is critical to our mission of measuring, understanding, and predicting population change and its impact. Donate to Carolina Demography today.