North Carolina: Census 2020 Real-Time Response Rates – Week ending June 7 (.pdf)
View All County-Level Response Rates –
Week ending June 7
Key takeaways for biweekly period ending 6/7
- North Carolina is now ranked 33 out of 50 states and DC in terms of overall Census response, a rise of one position over the last report. This is North Carolina’s highest ranking to date, with a response rate of 57% of households. NC currently trails behind the highest-ranking state, Minnesota, by 13.4 percentage points (70.4%).
- The majority of highest-responding counties now exceed North Carolina’s state self-response rate from 2010. Union (68.7%), Orange (67%), Wake (66.2%), and Davie (65.3%) counties all exceed the 2010 state self-response rate (64.8%). The fifth-ranked county, Chatham County, is just 0.2 percentage points shy of this rate, as well.
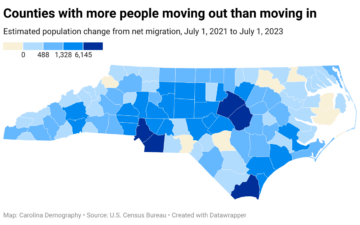
- Less than 1 in 3 households have responded in lowest-responding counties. The bottom five counties – located in rural areas mostly throughout the western portion of the state – have self-response rates of 29% or less: Dare (29%), Jackson (27.5%), Swain (27.2%), Graham (24%), and Avery (23.4%).
- North Carolina’s below average response is driven by lagging online response. As of June 7th, 44.8% of NC households had responded to the census online versus 48.8% of households nationwide. NC households were slightly more likely to respond by phone or mail than national average (12.2% vs. 11.9%).
- The response rate gap between the state and tracts with fewest young children stalls. For three weeks, the gap between this target group and the state has maintained at 2.3 percentage points. This week, 54.7% of households in tracts with less than 4.1% young children have officially responded to the Census versus 57% statewide.
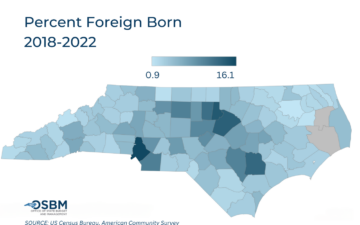
- Tracts with the fewest foreign-born residents have the lowest average response rate. In tracts where less than 2.9% of the population is foreign-born, the average response rate was 52.9%, 4.1 percentage points below the state average. In places where the foreign-born share of population was 2.9% or higher, the average response rate was above the state average.
- Response in majority non-white tracts lag state average. Just over 50% of households in tracts where the majority of residents are American Indian, Asian, Black, or Hispanic/Latinx have responded to the census, 6.7 percentage points below the state average.
- Largest response rate disparities exist between households with high and low internet access. Households where less than 12% of the population lacked access to internet had an average response rate of 65.6% – 8.6 percentage points above the state. In tracts where over 31% of households lacked internet access, an average of 48.8% of households have responded – 8.2 percentage points below the state.
Last updated: 6.9.20