North Carolina: Census 2020 Real-Time Response Rates – Week ending August 2 (.pdf)
View All County-Level Response Rates –
Week ending August 2
Key takeaways for biweekly period ending 8/2
- North Carolina now ranked 35th out of 50 states and DC. As of August 2nd, 59% of households responded to the Census in North Carolina, compared to 62.8% of households nationwide. North Carolina rose one ranking from the previous two-week period, but the response rate gap with the nation (-3.8 percentage points) has remained constant for the past month.
- The gap between the top-responding county and bottom-responding county is over 40 percentage points. 70.5% of households responded in Union County, the highest-ranked county in North Carolina, compared to 29.3% of households in Avery County, ranked 100th. This represents a gap of 41.2 percentage points in total.
- At least 50% of households have responded in nearly three-fourths of all NC counties. In total, 74 counties out of 100 have a response rate of 50% or higher.
- Tracts with the second-largest share of young children consistently have the highest response rates. Among categories in this target group, tracts with a moderate share of young children (5.5% to 7.2% of the population) have had the highest average self-response rate since reporting began. Currently, an average of 61% of households have responded in these tracts – 2 percentage points above the state.
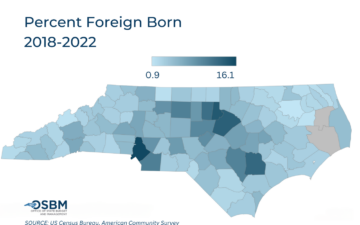
- Tracts with moderate to high shares of foreign-born residents have performed best. Across categories in this target group, tracts with moderate (5.7% to 9.8%) to high shares (9.8% or higher) of foreign-born residents have had the highest average response rates. As of August 2nd, an average of 60.7% and 60.5% of households have responded, respectively.
- All tracts under 50% minority have response rates above the state average. Average response rates ranged from 59.5% to 63.9% for tracts with all but the largest share of non-white residents (under 50% minority). These three categories all responded at rates above the state average.
- As internet access decreases, so do self-response rates. In this target group, internet access has been consistently correlated with self-response rates. As the share of households without internet increases, the average self-response rate decreases for every category. There is currently a 16.6 percentage point gap between households with the highest access (less than 12% of households lack access) and households with the lowest access (31% or more households lack internet access).
Last updated: 8.4.20