North Carolina: Census 2020 Real-Time Response Rates – Week ending July 19 (.pdf)
View All County-Level Response Rates – Week ending July 19
Last updated: 7.21.20
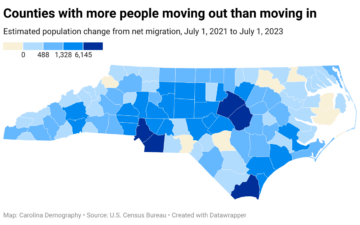
Last week, the U.S (United States). Census Bureau released 2023 county population estimates. These annual estimates tell us how county populations in North Carolina have changed over the course of a year: in this case, between July 1, 2022 and…
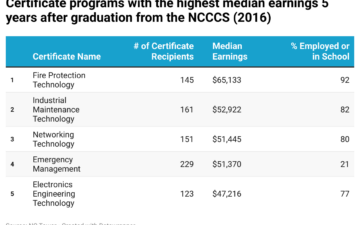
Deciding which educational pathway to pursue is often a daunting decision for a high schooler transitioning to postsecondary education. There are many questions a student must ask. Do I want to pursue a credential or a degree awarding program? What…
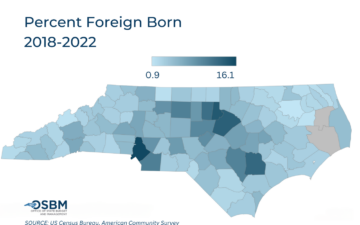
Dr. Michael Cline is the state demographer for North Carolina at the Office of State Budget and Management and has given us permission to re-post his content here. The original version of this piece is here. The foreign-born population in…
Your support is critical to our mission of measuring, understanding, and predicting population change and its impact. Donate to Carolina Demography today.