North Carolina: Census 2020 Real-Time Response Rates – Week ending August 31 (.pdf)
View All County-Level Response Rates –
Week ending August 31
- North Carolina’s self-response rate is over 4 percentage points behind the nation. As of August 30th, 60.7% of households in North Carolina have responded to the Census, compared to 64.9% of households nationally – a gap of 4.2 percentage points. This grew from 3.8 percentage points earlier this month.
- North Carolina now ranked 37th out of 50 states and DC. Earlier this month, North Carolina fell to the rank of 37th out of 50 states and DC. It has not received this ranking since April previously.
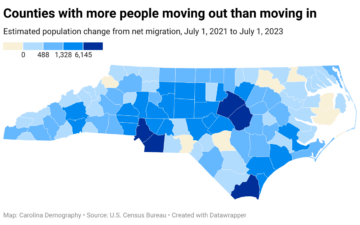
- Thirty-three counties exceed the state self-response rate (60.7%). These counties span the entire state, but the majority are located in North Carolina’s metropolitan areas.
- Fifteen counties in North Carolina have exceeded their 2010 self-response rate. Interestingly, many of these are very rural counties, such as Bertie, Haywood, and Jackson counties.
- Response rate gap widens again between state and tracts with fewest young children. As of Sunday, 58.3% of households responded to the Census in tracts with the fewest young children. This represents a gap of 2.4 percentage points from the state – larger than any gap previously between this target group category and the state.
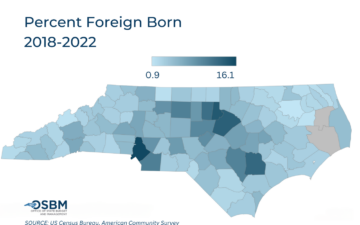
- Gap widens between tracts with fewest foreign-born residents and the state. Tracts where less than 2.9% of the population is foreign-born had an average self-response rate of 56.4% – 4.3 percentage points below the state. This represents the largest gap between this target group category and North Carolina since reporting began.
- Tracts with populations under 50% minority exceed the state average. In the three tract groupings under 50% minority, average response rates ranged from 61% to 65.7%, representing a lead of 0.3 to 1 percentage point ahead of the state.
- Fewer than 3 in 5 households have responded in tracts with moderately low to very low internet access. In tracts where 21-31% of households lacked internet access, an average of 58.2% of households responded – 2.5 percentage points below the state. In tracts with 31% or more households lacked internet access, this gap increased to 8.5 percentage points (52.2% vs. 60.7%).
Last updated: 9.3.20