North Carolina: Census 2020 Real-Time Response Rates – Week ending September 21 (.pdf)
View All County-Level Response Rates –
Week ending September 21
- North Carolina did not change in ranking this month. Since our last report – ending August 30th – North Carolina has maintained its ranking of 37th out of 50 states and DC. As mentioned in last month’s report, this is North Carolina’s lowest ranking since April.
- North Carolina ranked 6th among southeastern states. There are currently five southeastern states with self-response rates greater than North Carolina: Virginia (70.5%), Kentucky (67.7%), Tennessee (65.3%), Florida (62.8%), and Alabama (62.6%).
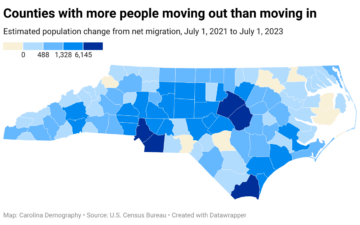
- Twenty-three NC counties now exceed their 2010 self-response rate. This is up eight counties from last month’s report. There is at least one county exceeding its 2010 Census-year response rate in all eight NC Prosperity Zones.While this is great to see, it still means that many housing units have not been counted in these counties, and there is still room for improvement as we push towards the end of the Census self-response period.
- North Carolina lags the national self-response rate by 3.8 percentage points. In North Carolina, 62.2% of households have responded to the Census, compared to 66% of households nationwide. This gap is down 0.4 percentage points from last month’s report.
- Nearly 3 in 10 North Carolina households have been counted during Non-Response Follow-Up (NRFU). 29.5% of North Carolina housing units have been counted during NRFU, slightly above the national average of 29.2%. As a result of the state’s lower self-response rate, 91.8% of North Carolina housing units have been counted – below the national share of 95.4%.
- Young children remain at risk for an undercount. Tracts with the highest share of young children (7.2% or more ages 0-4) had an average response rate 1.4 percentage points below the state average as of September 20th: 60.8% vs. 62.2%.
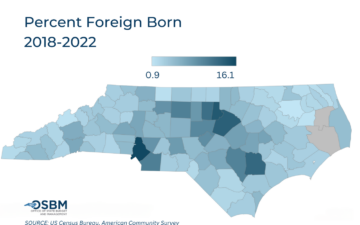
- Gap also widens between tracts with fewest foreign-born residents and state. 57.7% of households responded in tracts where less than 2.9% of the population is foreign-born, compared to 62.2% statewide. This represents a gap of 4.5 percentage points. This is also the largest gap recorded for this target group category and the state.
- Tracts with >50% minority residents have a response rate gap of nearly 7 percentage points from the state, placing these communities at increased risk of an undercount. Households in these tracts had an average response rate of 55.6% – 6.6 percentage points below the statewide response rate.
- The response rate gap between tracts with highest internet access and lowest internet access is over 17 percentage points. 70.9% of households have responded in tracts where less than 12% of households lack internet access, compared to 53.5% of households in tracts where >31% of households lack internet access.
Last updated: 9.21.20