North Carolina: Census 2020 Real-Time Response Rates – Week ending April 19 (.pdf)
View All County-Level Response Rates –
Week ending April 19
Key takeaways for week ending April 19
- North Carolina’s ranking falls for the first time since reporting began. As of April 19th, North Carolina ranked 38 out of 50 states and DC – a decline from last week’s ranking of 36. North Carolina’s current response rate stands at 46.6% of households.
- Nationwide phone/mail response rate climbed substantially last week, nearly meeting NC’s mail response rate. 6.5% of households in the nation have now responded by mail or phone – up 0.8 percentage points from last week (April 12th). This is compared to 6.7% of NC households, a gap of 0.2 percentage points. In the previous four weeks, the gap between NC and the nation averaged 0.7 percentage points.
- Eight southeastern states outrank North Carolina in self-response – up from 7 last week. These are Virginia (55.7%), Kentucky (53.0%), Tennessee (49.8%), Alabama (49.3%), Florida (48.7%), Mississippi (48.1%), Georgia (47.7%), and Arkansas (46.8%).
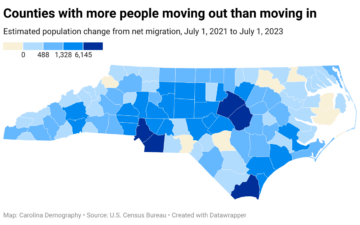
- Gap of 39 percentage points between highest-responding county and lowest-responding county in NC. 56.8% of households have responded in Orange County, ranked first among counties in North Carolina, compared to 17.7% of households in Graham County, ranked 100th. This represents a gap of 39.1 percentage points overall. As mentioned in previous newsletters, NC’s lowest-ranking counties have been especially hard-hit by the suspension of Census operations due to COVID-19.
- Over half of households have responded in all of North Carolina’s top-five responding counties. These counties are: Orange (56.8%), Union (56.6%), Wake (55.9%), Chatham (54.3%), and Davie (51.9%). Response in our highest-responding counties still lags self-response in the highest responding state of Minnesota (60.4%).
- The response rate for tracts with high shares of young children lag behind state overall response rate. 45.5% of households have responded to the Census in census tracts where 7.2% of the population or higher are ages 0-4 – a gap of 1.1 percentage points from the state response rate. This represents the second-lowest-responding group, behind census tracts with the lowest share of young children (44.5%).
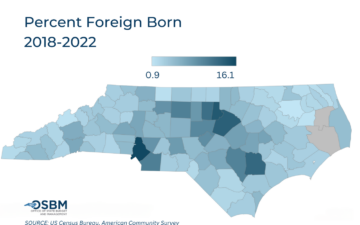
- Census tracts with smallest shares of foreign-born residents have the lowest response rates. An average of 42.8% of households responded to the Census in tracts where less than 2.9% of residents are foreign-born – 3.8 percentage points below the state average. Census tracts with the largest share of foreign-born residents (9.8% or higher) had an average response rate of 48.4% – 1.8 percentage points above the state.
- Lowest response rates in tracts with the largest and smallest shares of minority residents. In tracts where less than 14% of the population was non-white, the average response rate was 46.5% – 0.1 percentage point below the state. This gap has remained steady for several weeks. Meanwhile, in tracts where 50% or more of the population was non-white, the average response rate was 41.5% – 5.1 percentage points below the state. This gap has risen each week.
- Over half of households have responded in census tracts with high internet access. In census tracts where less than 12% of households lack internet access, the average response rate was 54.9% – 8.3 percentage points above the state. This is the highest-performing state target group.
Last updated: 4.21.20