North Carolina: Census 2020 Real-Time Response Rates – Week ending April 26 (.pdf)
View All County-Level Response Rates –
Week ending April 26
New: NC college maps and tract data
Key takeaways for week ending April 26
- North Carolina maintains ranking of 38th out of 50 states and DC. For the week ending April 26th, North Carolina’s ranking neither rose nor fell. Until last week’s report, the state’s ranking had risen weekly, before falling to 38th as of April 19th. Its current response rate stands at 48.5% – a rise of 1.9 percentage points from last week.
- Gap steadily widens between North Carolina and the nation. As of April 26th, North Carolina’s response rate was 48.5%, compared to the national response rate of 53.2%. This represents a gap of 4.7 percentage points – the largest single-week gap since reporting began. This disparity has steadily risen each week as the nation pulls rapidly ahead of North Carolina.
- Nation now has higher online and mail and phone response rate. Since reporting began, the national online response rate has always outpaced North Carolina, but for the first time this week, the nation now has a higher mail and phone response rate, as well. As of April 26th, 41% of households in NC responded online vs. 45.3% of households nationally, and 7.5% of NC households responded by mail or phone vs. 7.9% of households nationwide.
- Eight southeastern states outrank North Carolina – five of whom now have a response rate exceeding 50% of households. These eight states are Virginia (57.8%), Kentucky (56.2%), Tennessee (52.3%), Alabama (51.5%), Florida (51.1%), Georgia (49.9%), Mississippi (49.6%), and Arkansas (48.9%).
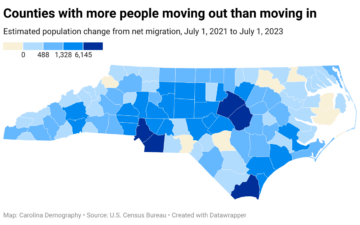
- Response rates in top 5 counties exceed half of households, while fewer than 1 in 4 households have responded in all bottom 5 counties. The top five counties – Union (59.5%), Orange (59.4%), Wake (58.2%), Chatham (56%), Guilford (54.2%) – are located in urban metropolitan areas. The bottom five counties – Graham (18.2%), Avery (19.6%), Jackson (23%), Swain (23.7%), Dare (24.4%) – are primarily rural.
- Response rates in tracts with fewest young children average 1.5 percentage points below the state. Over the course of reporting, the average response rate for tracts with less than 4.1% of the population ages 0-4 averaged about 1.5 percentage points below the state. The gap for this week alone was 1.9 percentage points – 46.6% vs. 48.5%.
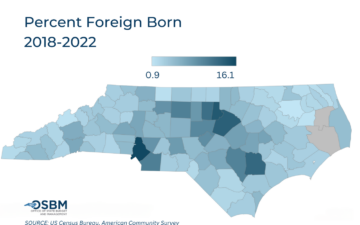
- Average response rates exceed 50% of households for top 2 tracts with the largest shares of foreign-born residents. In tracts where 5.7 – 9.8% of the population was foreign-born, an average of 50.2% of households have responded to the Census. In tracts where over 9.8% of residents are foreign-born, this average increases to 50.5% of households.
- Gap between state average and tracts with largest minority populations continue to widen. As of April 26th, tracts with over 50% of non-white residents had an average response rate of 43.1% – 5.4 percentage points below the state. This gap has widened steadily each week.
- Gap between the state and households with low internet access remains the largest of any target group. The average response rate was 41.4% for tracts where over 31% of households lacked internet access – 7.1 percentage points below the state. This gap has also steadily risen over the course of reporting.
Last updated: 4.28.20