North Carolina: Census 2020 Real-Time Response Rates – Week ending April 5 (.pdf)
View All County-Level Response Rates –
Week ending April 5
Key takeaways for week ending April 5
- North Carolina’s overall response rate is 42%. By the start of the third week of Census reporting, North Carolina’s self-response rank had risen 6 spots from the first reporting date to 37 out of 50 states and DC. Nationally, 45% of households have responded to the Census.
- NC’s online response rate continues to lag behind the nation. North Carolina’s online self-response rate is 35.7% – 3.6 percentage points lower than the national average (39.3%). This is an important roadblock, as online responses form the overwhelming majority of all responses both statewide and nationally.
- North Carolinians are more likely to respond by mail or phone than the national average. For the past three weeks of reporting, a larger share of North Carolina households have responded by mail or phone (6%) than the nation (5.2%), and this disparity continues to rise.
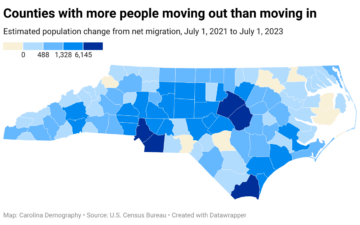
- All five top-responding counties in North Carolina are located in a metropolitan area. These are Orange, Union, Wake, Chatham, and Guilford counties.
- The five lowest-responding counties likely impacted by suspension of Census Bureau field operations. Graham, Avery, Jackson, Dare, and Swain counties had high proportions of households that will be counted by “Update/Leave”—most of these households have not yet received their invitation to respond to the census.
- Response lags in Census tracts with the largest minority populations. In census tracts where 50% or more of residents were non-white, the average response rate of 37.4% lagged the state average by 4.3 percentage points.
- Census tracts with low household internet access had the lowest response rates. In census tracts where over 31% of households lacked internet, the average response rate was 36.4% – a gap of 5.3 percentage points from the state average. In contrast, in tracts with the highest rates of internet access, nearly half (49%) of households had completed the census.
- Responses also lag behind the state in tracts with largest and smallest child populations. In census tracts where either less than 4.1% of residents or over 7.2% of residents were ages 0-4, the average response rate fell below the state average. This gap was largest for census tracts with the smallest child population (-1.8 percentage points). This may be related to poor response in areas such as college towns, where displacement due to COVID-19 is highest.
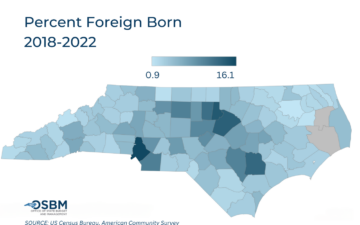
- Tracts with highest immigrant populations have highest average response rates. Tracts where 9.8% or more of the population is foreign-born had the highest average response rate (43.3%), followed by tracts with 5.7% to 9.8% foreign-born residents (43.1%). Tracts with few immigrants (<2.9% of residents) had the lowest average response rate (38.5%).
-
-
Last updated: 4.7.20