The U.S. Census is used to determine the number of seats each state has in the US House of Representatives and for redistricting at the national, state, and local level. Census data is also used to allocate almost a trillion dollars in federal aid to states and localities, and informs policymakers and economic development leaders so that they can be effective in planning and placing services for growing and changing populations.
Achieving a complete and accurate count is not simple. The biggest challenge in conducting the census is getting households to mail back or complete their forms online or by phone, a process known as self-response. Higher self-response rates reduce the overall costs of conducting the census. And, when individuals self-respond, the data is more accurate.
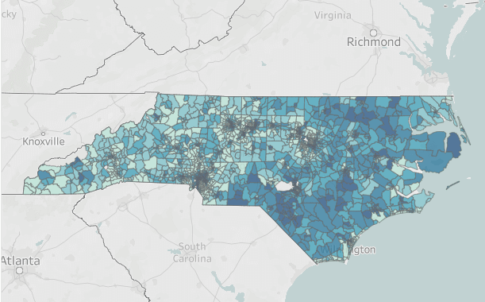
An inaccurate count paints a distorted picture of the make-up of our communities and will result in a misallocation of resources within North Carolina. To help North Carolina achieve a complete and accurate census count, Carolina Demography worked with the NC Counts Coalition to create a map that identifies communities across the state that are most at-risk of being undercounted in the 2020 Census.
“Stakeholders and partners were asking for user-friendly maps to better target outreach to hard to count populations. And we needed more information on hard-to-count communities in North Carolina to determine where we will place our resources and target our outreach efforts.”
- Stacey Carless, Executive Director, NC Counts Coalition
Historically, certain population groups, referred to as “hard-to-count” populations or communities, have not been fully counted and represented in the census count. North Carolina’s hard-to-count communities include:
Analyzing past Decennial Census participation rates can be helpful to communities in planning outreach to the populations that have previously had a low participation rate.
We created an interactive tool based on low-response scores and 2010 response rates from the U.S. Census Bureau’s 2018 Planning Database and the most up-to-date community characteristics from the U.S. Census Bureau’s 2017 5-Year American Community Survey. The tool also provides reasons why certain populations may be hard to reach or count.
NC Counts is using the map to better target their outreach efforts and to provide a better understanding of hard-to-count communities in NC.
NC Counts Coalition
To create a map that identifies communities across the state that are most at-risk of being undercounted in the 2020 census.
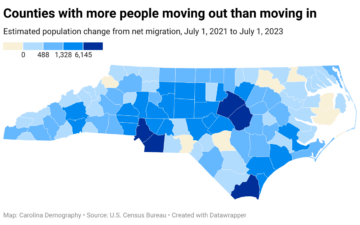
Last week, the U.S (United States). Census Bureau released 2023 county population estimates. These annual estimates tell us how county populations in North Carolina have changed over the course of a year: in this case, between July 1, 2022 and…
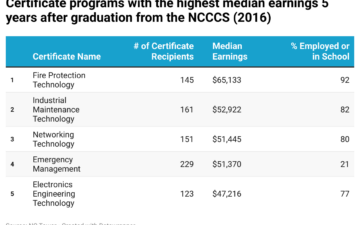
Deciding which educational pathway to pursue is often a daunting decision for a high schooler transitioning to postsecondary education. There are many questions a student must ask. Do I want to pursue a credential or a degree awarding program? What…
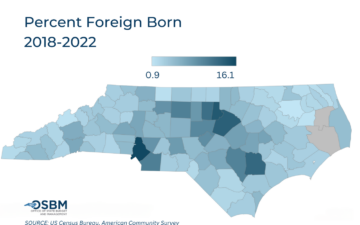
Dr. Michael Cline is the state demographer for North Carolina at the Office of State Budget and Management and has given us permission to re-post his content here. The original version of this piece is here. The foreign-born population in…
Your support is critical to our mission of measuring, understanding, and predicting population change and its impact. Donate to Carolina Demography today.